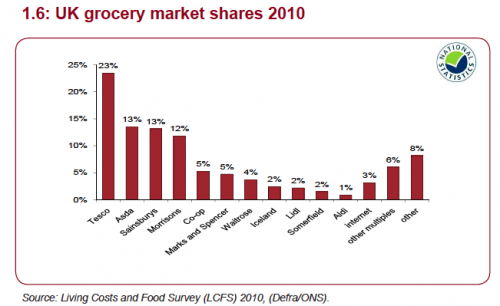
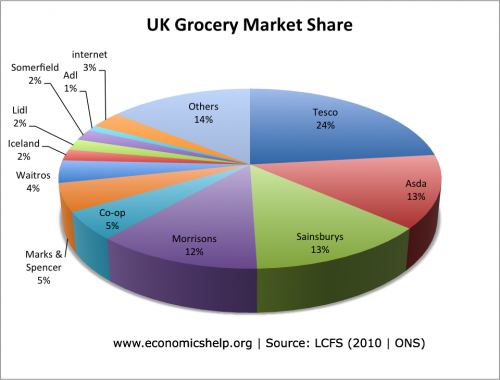
The market share of leading supermarkets, in the UK grocery market industry.

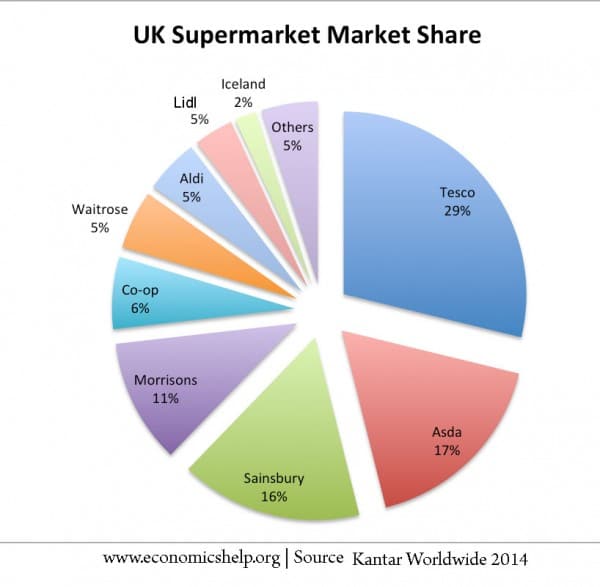
Market share 2014 – see: Battle for UK Supermarket market share

Blog from 2012

The UK supermarket industry often makes a popular data response question.

The five firm concentration ratio for the industry is 66% – a case of an oligopoly.
- Tesco – 23%
- Asda 13%
- Sainsbury’s 13%
- Morrisons 12%
- Co-op 5%
- Marks & Spencers – 5%
- Waitrose – 4%
- Iceland – 2%
- Lidl – 2%
- Somerfield – 2%
- Aidl – 1%
- internet – 3%
- Others – 14%
Tesco is the leading UK grocery store, but its market share has fallen from 25% in 2009.
Historical market Share over the years
from food desserts
Why is data slightly different? Perhaps a slightly different way of defining the grocery market. Is it market share of supermarkets or any kind of place to buy food, e.g. petrol stations?
Tesco
- 1971, 7.2%
- 1974, 8.6%
- 1977, 8.3%
- 1978, 12.4%
- 1982, 14.3%
- 1984, 11.9%
- 1986, 13.4%
- 1987 12.0%
- 1988, 14.8%
- 1990, 15.7%
- 1992, 17.2%
- 1993, 18.0%
- 1994, 18.3%
- 1995, 20.8%
- 1996, 21.5%
- 1997, 22.6%
- 1998, 23.0%
- 1999 23.7%
- 2000, 25.0%
- 2001 25.2%
- 2002, 25.9%
- 2003, 27.0%
- 2004, 28.0%
- 2005, 30.4%
- 2006, 31.1%
- 2007, 31.3%
- 2008, 31.1%
- 2009, 30.7%
- 2010, 30.6%
- 2011, 30.4%
- 2012, 29.7%
Sainsbury
- 1970 6.1%
- 1973 7.0%
- 1976 7.7%
- 1978 10.6%
- 1982 14.5%
- 1984, 11.6%
- 1987, 12.3%
- 1988, 14.5%
- 1990, 16.3%
- 1992, 19.5%
- 1993, 19.6%
- 1994, 20.0%
- 1995, 19.1%
- 1996, 19.7%
- 1997, 19.6%
- 1998, 19.0%
- 1999, 18.2%
- 2000, 17.9%
- 2001, 17.8%
- 2002, 17.1%
- 2003, 16.2%
- 2004, 15.7%
- 2005, 15.9%
- 2006, 16.2%
- 2007, 16.3%
- 2008, 16.2%
- 2009, 16.3%
- 2010, 16.6%
- 2011, 16.3%
- 2012, 16.6%
Asda
- 1970 1.5%
- 1973 2.5%
- 1976 4.7%
- 1978 6.3%
- 1980 8.0%
- 1982 9.3%
- 1984, 7.2%
- 1987 7.2%
- 1988, 7.9%
- 1990, 9.4%
- 1992, 9.4%
- 1993, 9.5%
- 1994, 9.9%
- 1995, 10.7%
- 1996, 11.8%
- 1997, 12.5%
- 1998, 13.0%
- 1999, 13.2%
- 2000, 14.1%
- 2001 14.7%
- 2002 16.1%
- 2003, 16.2%
- 2004, 16.6%
- 2005, 16.5%
- 2006, 16.6%
- 2007, 16.7%
- 2008, 17.0%
- 2009, 17.0%
- 2010, 16.9%
- 2011, 17.1%
- 2012, 17.2%
Co-op
- 1915, 18 – 20%
- 1939, 14.1%
- 1965, 35.0%
- 1980, 9.0%
- 1987, 7.6%
- 1989, 7.6%
- 1990, 8.2%
- 1991, 8.1%
- 1992, 7.6%
- 1993, 6.9%
- 1994, 6.6%
- 1995, 6.5%
- 1996, 6.1%
- 1997, 5.9%
- 1998, 4.7%
- 1999, 6.2%
- 2000, 5.4%
- 2001, 5.0%
- 2003, 5.2%
- 2004, 5.0%
- 2007, 4.7%
- 2008, 8.1% inc S’field
- 2009, 7.7% inc S’field
- 2010, 6.6% inc S’field
In 2010, total UK supermarket sales totalled £150.8 billion.
Between 1972 and 2010 per capita real spending on food has therefore risen by 83.8% over this period, an annual rise of 1.6%.
Related
