The welfare state typically includes all benefit payments (pensions, unemployment insurance, child benefits, income support e.t.c). The modern UK welfare state was founded in 1948 with the aim of providing ‘cradle to the grave protection’. The intention was that welfare payments would help people through temporary periods of difficulty, such as sickness and unemployment. There was also to be a contributory state pension system. Since 1948, the cost of the welfare state has (adjusted for inflation) increased from £11b to £200bn an 18* increase.
Is this a great achievement – enabling the elimination of absolute poverty? or does it represent a failure to prevent unnecessary government spending?
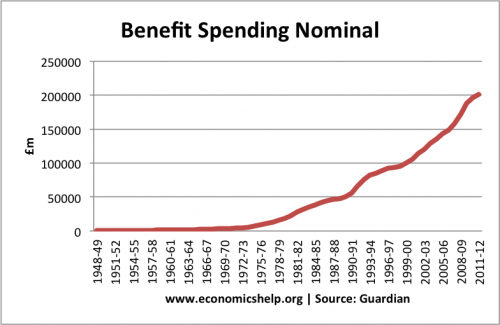
- Nominal government benefits have increased from £471m in 1947-48 to £200,978 m in 2011-12 (£200bn)
- In 2012, state pensions cost £74bn making state pensions the largest component of social security spending.
Adjusted for inflation, the increase in social security payments is still significant.
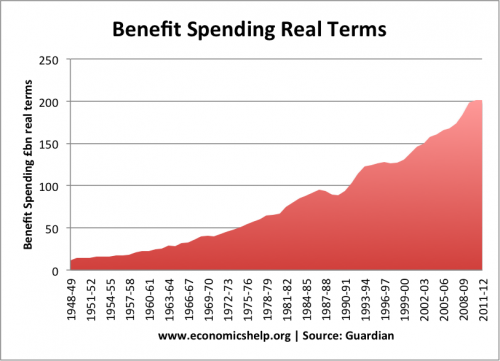
From £11bn in 1948-49 at the start of the welfare state to £200bn in 2011-12. – 18* increase in the real level of benefits paid for by the government.
When the welfare state was created in 1948, such a level of benefits probably wasn’t imagined. Many claim the welfare state has ‘ballooned’ out of proportion and needs reigning in.
However, it is worth bearing in mind.
- The growth in welfare payments is partly a reflection of higher GDP, improved expectations and improved life expectancy. The country can afford to be more generous in paying welfare payments because Real GDP has increased significantly since 1949.
- The welfare state has helped to end the widespread absolute poverty which existed in Britain in the period preceding the welfare state.
- In 1948, life expectancy was lower. The pension budget has increased as people live longer.
- Rising real wages have meant that benefits have often increased by more than inflation to maintain relative living standards of the poorest in society. If benefits are index-linked and not linked to real wage growth, there will be rising relative poverty as the poorest fall behind the rest of society.
Benefit Spending as a % of GDP in Post War Period
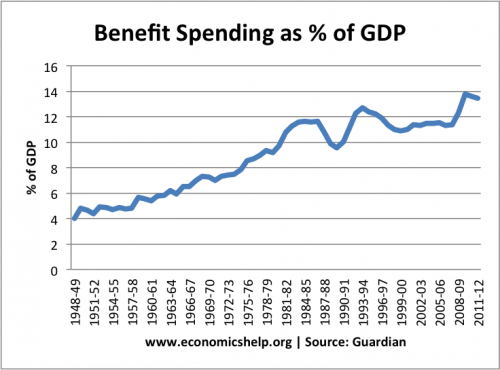
- However, even as a % of GDP, we can still see a rapid growth in the importance of government benefits as a % of GDP. From 4% of GDP in 1948 to 13% in 2011-12.
- Note the cyclical changes – as a % of GDP benefits increase sharply in recession, but fall in a boom. Nevertheless, there is a long-term upward trend.
UK Compared to the Rest of the World
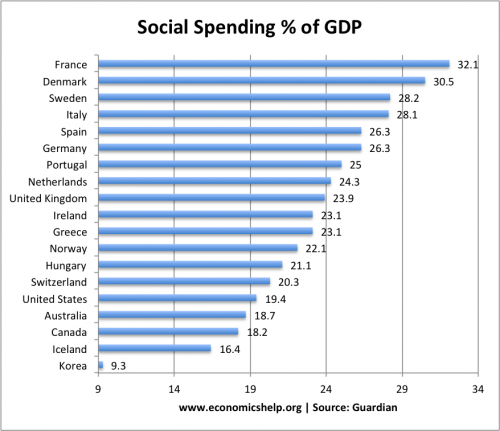
Compared to other developing economies, the UK’s spending on social security is fairly average. Some countries, like Korea, have a much lower % of GDP. Other Countries like France, Denmark and Sweden have a much higher % of GDP spent on social security. Which countries have the highest standard of living?
Is it a good thing the welfare state has increased in size?
- It could be seen as an achievement, that we are able to devote a higher % of national income to reducing relative poverty and income inequality. For example, in 1948, we devoted a much higher % of GDP to military spending. In the post-war period, military spending has fallen, social security has increased. In return, we have a better income during our retirement, and there have been improvements in living standards across the income spectrum.
- Critics may argue that, although the welfare state has achieved many good things, it is now getting to a point where we are not solving poverty but creating a welfare dependency culture. Too many are relying on benefits and this creates a disincentive to work. The government argue that we need to reform the welfare state to avoid this kind of disincentives.
- Not all benefits are given to those out of work. Many on low income are entitled to income support (soon to be universal credit). This shows that the benefits system isn’t necessarily encouraging people to be scroungers, but is supporting those who move into low paid jobs. By not reducing all benefits for low paid work, the marginal tax of getting a job is lower, and the incentive is still there.
- (19% of those on housing benefits are in work. 81% are out of work)
- (10% on disability allowances work. 90% are out of work)
- The biggest growth in benefits is from state pensions. This is a reflection of the fact we live longer, and real incomes are higher. The increased life expectancy is a good achievement. But, if we are living much longer, an increase in the pension age may be needed to keep the pension bill affordable.
- It depends very much how benefits are designed. The idea of a safety net for temporary periods of unemployment and sickness is something most people would happily support. The concern comes at the idea that benefits can create a lifetime of dependency. Whether that is occurring we can’t necessarily see from these statistics alone, we need to delve much deeper.
Notes:
Total government benefit spending includes the traditional welfare payments (such as unemployment, income support (universal credit from 2013), child support, housing benefits) plus contributory benefits, notably pensions.
Related
- Welfare stats at Guardian
- Latest stats at gov.uk
2 thoughts on “The growing size of the welfare state in the UK”
Comments are closed.