GDP per capita is a measure of average income per person in a country.
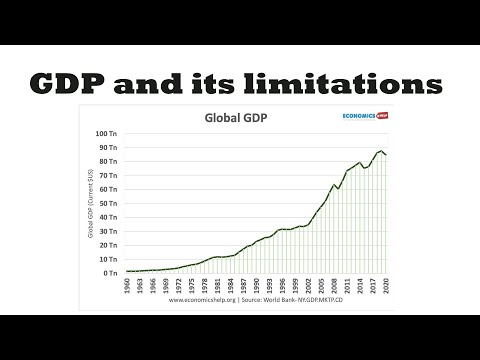
- GDP stands for Gross Domestic Product. This measure National income / National Output and National expenditure.
- GDP per capita divides the GDP by the population.
- Real GDP per capita takes into account inflation.
World Map of GDP per Capita

Top 10 GDP Per Capita($)
1 Qatar 88,222
2 Luxembourg 81,466
3 Singapore 56,694
4 Norway 51,959
5 Brunei 48,333
6 United Arab Emirates 47,439
7 United States 46,860
— Hong Kong 45,944
8 Switzerland 41,950
9 Netherlands 40,973
10 Australia 39,764
(21. United Kingdom 35,073)
Source: IMF
Lowest GDP Per Capita ($)
173 Afghanistan 909
174 Togo 863
175 Malawi 821
176 Sierra Leone 810
177 Niger 761
178 Central African Republic 747
179 Eritrea 683
180 Zimbabwe 436
181 Burundi 412
182 Liberia 396
183 Congo, Democratic Republic of the 329
Limitations of GDP Statistics
There is an interesting article in the Economist this week, which points out an obvious limitation in the main economic statistic – GDP growth.
- Basically, GDP growth measures the output of an actual economy. However, to gain a better understanding of average living standards we need to look at the growth of GDP per capita. For example, if one country has GDP growth of 4%, but the population increases in size by 4%, then the average citizen will have the same income.
- Another country could have zero GDP growth but, if the population is declining then the average citizen will be better off.
- The economist points out that when we use GDP per capita growth figures, Japan has actually outperformed the US economy. Because although actual GDP has increased faster in the US, this has been boosted by a growing population.
- It means that other fast-growing economies like India should also have their GDP statistics treated with caution. Although growth rates are much higher in India, it is partly boosted by a rapidly rising population.
- There are still many limitations in comparing GDP per capita statistics between different countries
- Need to take into account purchasing power parity of local currency.
- GDP only measures output excludes factors such as quality of the environment, level of pollution e.t.c. See: measures of economic welfare such as MEW and
GDP and Definition of a Recession?
A definition of a recession. Is a period of negative economic growth. However, if America has population growth of 1% a year and GDP growth of 0.9%; technically, the average citizen is seeing a decline in income. Therefore, this might be a better guide to when a recession actually occurs.
Why GDP is still Important
- However, GDP is still important. If we take Japan they have a national debt of 180% GDP. To reduce this national debt, Real GDP growth is more important than Real GDP per Capita growth.
- A falling population means an ageing population and worsening demographics which will only worsen the Japanese debt
Limitation of GDP per Capita Statistics
Related
Check out Robert F. Kennedy’s challenge to the GDP in this new video:
http://www.youtube.com/watch?v=e51JnJPPY0E
This is an update of the URL my friend Colin gave you for a video on RFK’s speech about the GDP. The video can now be found at
http://www.youtube.com/watch?v=77IdKFqXbUY
How do you work out GDP per capita when you are given the following statistics?
Population (millions) 60.9
Nominal GDP (US$bn) 2252
Real GDP growth 1.7
Current account balance -0.3
Inflation 1.9
from the current account balance, is the value of the pound increasing as there is a trade deficit and this usually occurs when there is a strong pound?
@Rina: the answer is Nominal GDP/population. I don’t think you can infer anything about the value of the pound since you’re talking only US statistics, i.e. no comparison available.