Summary of Phillips Curve
The Phillips curve suggests there is an inverse relationship between inflation and unemployment.
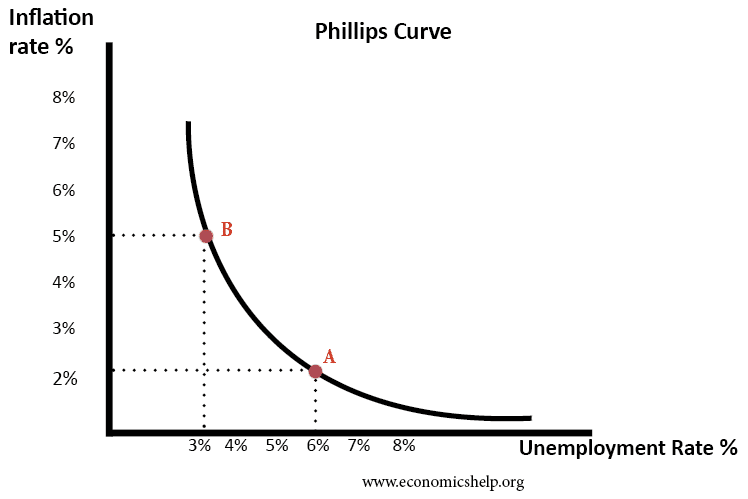
This suggests policymakers have a choice between prioritising inflation or unemployment. During the 1950s and 1960s, Phillips curve analysis suggested there was a trade-off, and policymakers could use demand management (fiscal and monetary policy) to try and influence the rate of economic growth and inflation. For example, if unemployment was high and inflation low, policymakers could stimulate aggregate demand. This would help to reduce unemployment, but cause a higher rate of inflation.
In the 1970s, there seemed to be a breakdown in the Phillips curve as we experienced stagflation (higher unemployment and higher inflation). The Phillips Curve was criticised by monetarist economists who argued there was no trade-off between unemployment and inflation in the long run.
However, some feel that the Phillips Curve has still some relevance and policymakers still need to consider the potential trade-off between unemployment and inflation.
Origins of the Phillips Curve
The Phillips curve originated out of analysis comparing money wage growth with unemployment. The findings of A.W. Phillips in The Relationship between Unemployment and the Rate of Change of Money Wages in the United Kingdom 1861–1957 suggested there was an inverse correlation between the rate of change in money wages and unemployment. For example, a rise in unemployment was associated with declining wage growth and vice versa.
Original Phillips Curve Diagram
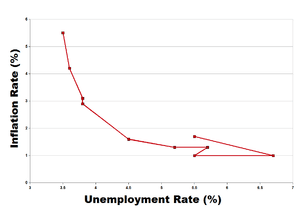
This analysis was later extended to look at the relationship between inflation and unemployment. Again the 1950s and 1960s showed there was evidence of this inverse trade-off between unemployment and inflation.
US Unemployment and Inflation
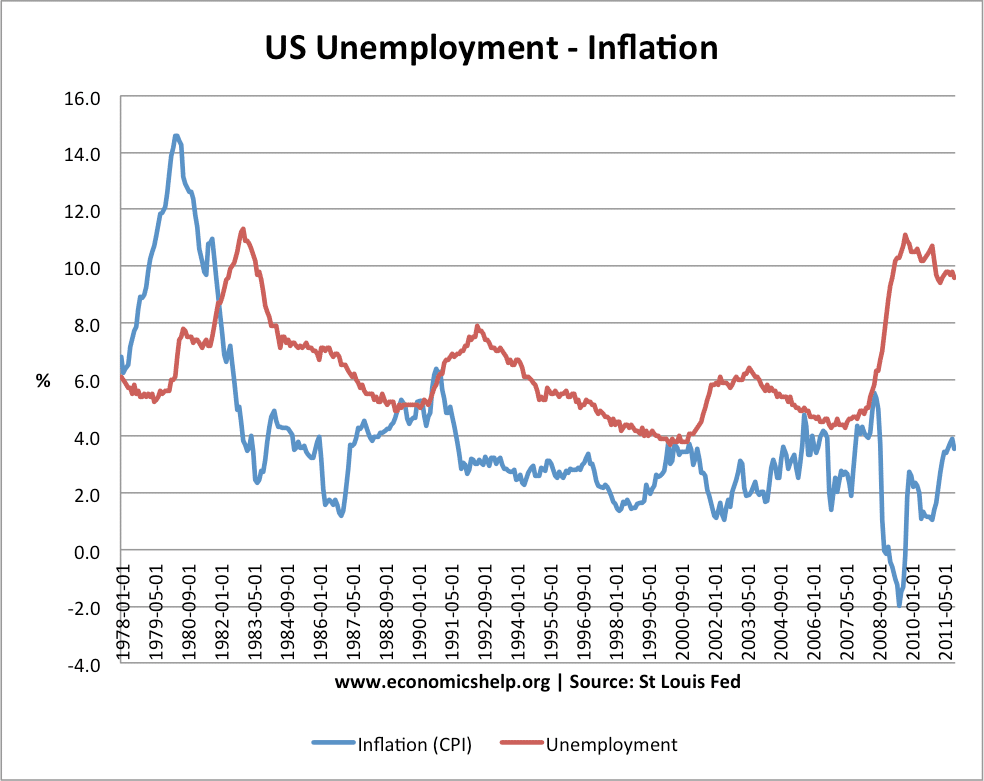
There are occasions when you can see a trade-off between unemployment and inflation. For example, between 1979 and 1983, inflation (CPI) fell from 15% to 2.5%. During this period, we see a rise in unemployment from 5% to 11%. In 2008, the recession caused a sharp rise in unemployment and inflation became negative.
Why is there a trade-off between unemployment and inflation?
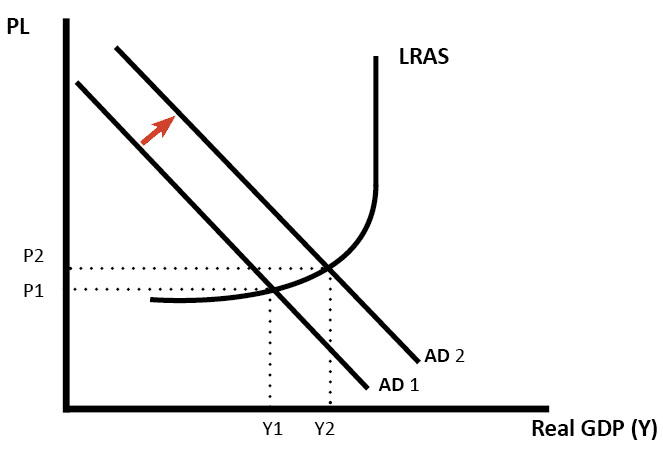
- An increase in aggregate demand (AD to AD2) causes higher real GDP (Y1 to Y2). Therefore firms employ more workers and unemployment falls.
- However, as the economy gets closer to full capacity, we see an increase in inflationary pressures. With lower unemployment, workers can demand higher money wages, which causes wage inflation. Also, firms can put up prices due to rising demand.
- Therefore, in this situation, we see falling unemployment, but higher inflation.
![]()
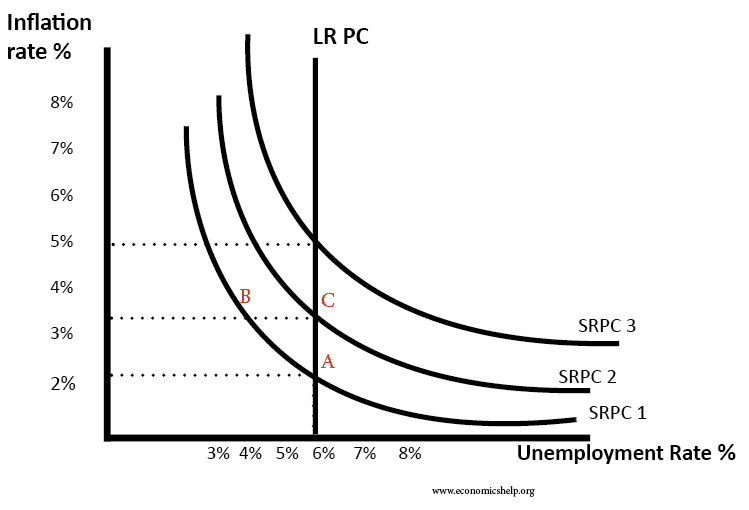
Monetarist View of Phillips Curve
However, Monetarists have always been critical of this Phillips curve trade-off. They argue that in the long run there is no trade-off as Long Run AS is inelastic. Monetarists argue that if there is an increase in aggregate demand, then workers demand higher nominal wages. When they receive higher nominal wages, they work longer hours because they feel real wages have increased. (their price expectations are based on last year)
However, this increase in AD causes inflation, and therefore, real wages stay the same. When they realise real wages are the same as last year, they change their price expectations, and no longer supply extra labour and the real output returns to its original level. Therefore, unemployment remains unchanged, but we have a higher inflation rate. The short-run Phillips curve shifts upwards to SRPC 2
Monetarist view of AD / AS
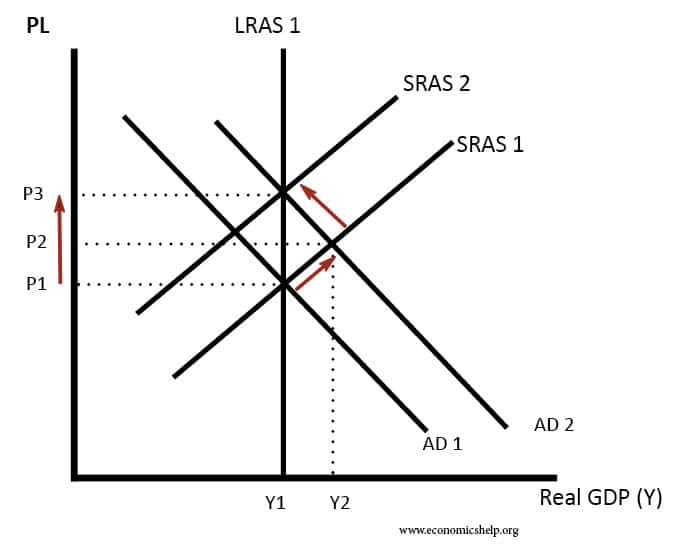
The increase in AD only causes a temporary increase in real output to Y1. After inflation expectations increase, SRAS shifts to left (SRAS2), and we end up with higher inflation (P3) and output of Y1. This AD/AS model explains why we only get a temporary fall in unemployment.
- Adaptive expectation monetarists argue there is only a short-term trade-off between unemployment and inflation.
- Rational expectation monetarists argue there is no trade-off, even in the short term. The rational expectation model suggests that workers see an increase in AD as inflationary and so predict real wages will stay the same.
Summary of Monetarist v Keynesian view
A monetarist would argue unemployment is a supply side phenomena. Monetarists argue using demand-side policies can only temporarily reduce unemployment by an ever-accelerating inflation rate. Monetarists argue that unemployment is determined by the natural rate of unemployment
Keynesians argue there can be demand deficient unemployment, and during a recession, demand-side policies can reduce unemployment in the long term (with perhaps some inflation)
The Phillips Curve Breakdown
Evidence from the 1970s suggested the trade-off between unemployment and inflation had broken down. The 1970s witnessed a rise in stagflation – rising unemployment and inflation. Monetarists argued that increasing the money supply just led to a wage inflation spiral and did not help to reduce unemployment. They advocated reducing the money supply and achieving low inflation – any unemployment would just prove temporary.
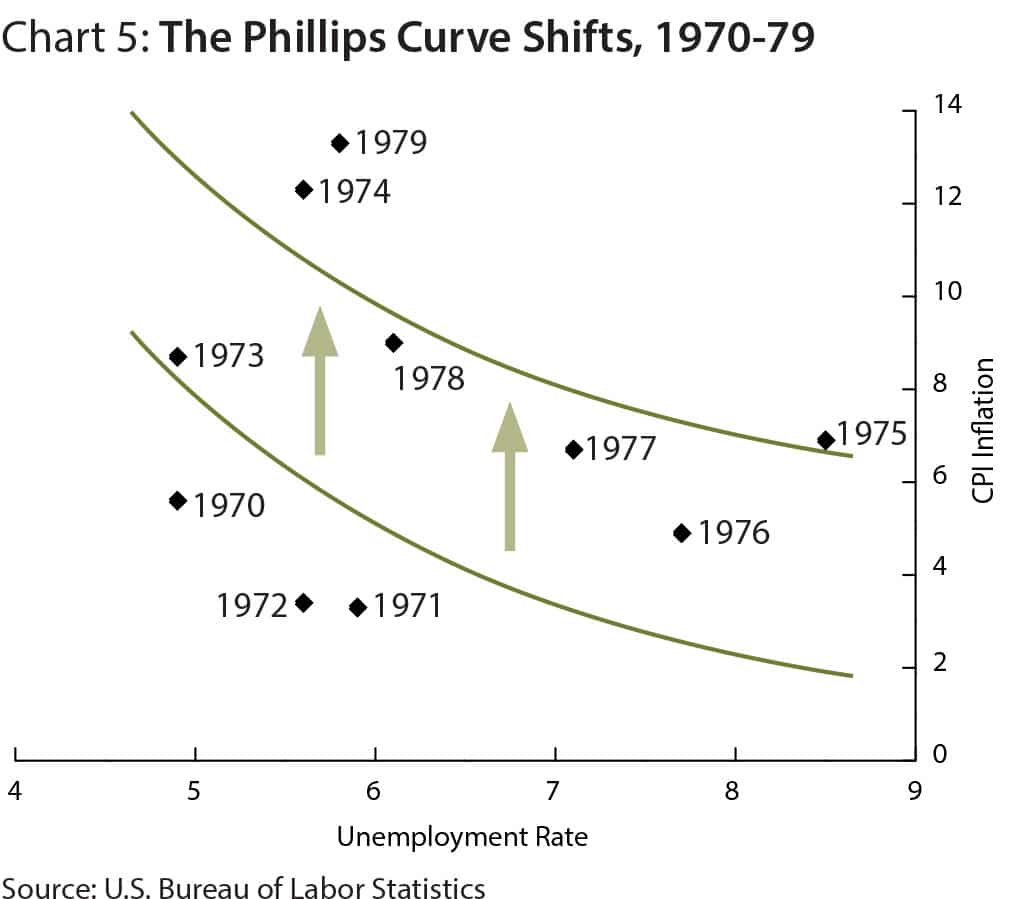
However, others argued there was still a trade-off – the Phillips curve had just shifted to the right giving a worse trade-off because of cost-push inflation.
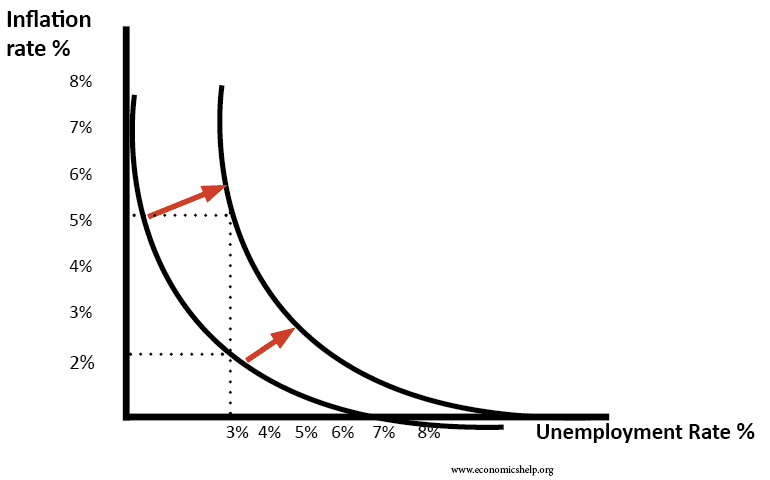
Shift in Phillips Curve to the right (the 1970s)
In the early 2000s, the trade-off seemed to improve. Helped by low global inflation, unemployment in the UK fell without any rise in inflation. Some argued this period of stability had ended the boom and bust cycles with the classic trade-off between inflation and unemployment. See: great moderation
Shift in Phillips Curve to the left
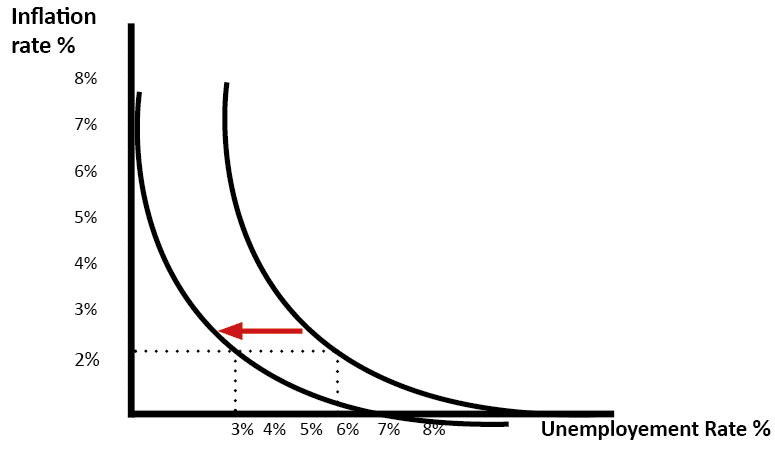
In late 2008 we saw a rise in the unemployment rate and a fall in inflation. This was due to the recession and falling oil prices.
However, in 2010-11, the UK experienced higher unemployment and higher inflation because of cost-push inflationary pressures. This was another period of stagflation

Very poor evidence of Phillips Curve trade off – 2000-2022.
Conclusion on Phillips Curve
If the economy is operating below full capacity, a significant increase in aggregate demand is likely to cause a reduction in unemployment and higher inflation. Most economists would agree that in the short term, there can be a trade-off between unemployment and inflation. However, there is a disagreement about whether this policy is valid for the long-term.
Monetarists would tend to argue the trade-off will prove short-term, and we will just get inflation. Monetarists place greater stress on the supply side of the economy.
However, Keynesians argue that demand deficient unemployment could persist in the long-term. If there is a significant negative output gap, boosting AD could lead to lower unemployment and a modest increase in inflation. In a deep recession, this fall in unemployment will not just be temporary because there will be no crowding out.
In an ideal world policymakers will aim for low inflation and low unemployment. To achieve this, we need economic growth that is sustainable (close to long-run trend rate) and supply-side policies to reduce cost-push inflation and structural unemployment. If these criteria are met then it becomes easier to achieve this goal of lower inflation and lower unemployment.
Relevance of Phillips Curve Today
In the current economic climate, many Central Banks and policymakers are weighing up how much importance they should give to reducing unemployment and inflation. For example, the Federal Reserve is considering using monetary policy to achieve an unemployment target and a willingness to accept higher inflation.
During 2009-13, the Bank of England has been willing to tolerate inflation above the government’s target of 2% because they feel to reduce inflation would have caused serious problems for unemployment and economic growth.
This willingness to consider a higher inflation rate, suggest policymakers feel that the trade off of higher inflation is worth the benefit of lower unemployment. However, not all economists agree we should be allowing the inflation target to increase. If we allow inflation to increase, inflationary pressures will become engrained, and monetary policy will lose credibility. The ECB would be unwilling to tolerate higher inflation – even as a measure to reduce unemployment in Europe.
source: of top two diagrams (original Phillips curve and Phillips curve 1960s US wiki
Hi,i am student of university of abuja nigeria.pls explain the relationship between unemployment and inflation with the aid of philip curve.
hi iam a student at polytechnic of Namibia.can you please explain the relationship between inflation and unemployment with the aid of phillips curve?
can you please explain the relationship between inflation and unemployment with phillips curve?
Statistics on inflation and unemployment for the UK support the view that the extreme trade off between unemployment and inflation that occurred in the past no longer exists, with both unemployment and inflation falling between 2011 and 2016.
It is argued that the effectiveness of supply side policies has meant that the economy can continue to expand without inflation
hi am yo can you please apply this phillips curve to effects of unemployment…
hi im asuman iddi anuar student of economics from kyambogo university kampala uganda please explain to me fully the relationship btwn inflation &unemployment using philips curve
aoa
I,m student of Islamia university from Pakistan. please guide me about policy implication of philips curve in macroeconomics..
I LOVE MILTON FRIEDMAN….. HE IS BAE
Hi I am Bashir Baboyo post graduate student of University of Maiduguri from Economic department what is this trade off mentioned in the explanation of Philip’s curve?
I am a student of economics. help me to understand the relationship between inflation and unemployment generally. explain the cycle by which rise in inflation cause fall in unemployment.
Hi I am a student of economics from Canada. I am not able to understand phillips curve where there is a relations between inflation and employment. Rest you have written very nice a article
Hi I am a student of economics from India. I am not able to understand phillips curve where there is a relations between inflation and employment. please guide me.
Hi I am a student from university of cape coast Department of economics. Please help me to understand the shift in the Philips curve and how policymakers make decisions in both short run and the long run