- Home repossession – when banks take homes back into their own ownership,
- Mortgage arrears – when mortgage holders fall behind in their mortgage payments, but not necessarily leading to repossession
- For 2013, the Council of mortgage lenders anticipate a total of 35,000 repossessions. In Q1 2013, the rate of repossession is running at 0.07% or 1 in 1,400 homes. This is the lowest rate since 2008. (Source: CML)
- In 2012, 157,900 homes were in arrears.
- It estimated, that 160,000 mortgages will be in arrears of 2.5% or more by end of 2013.
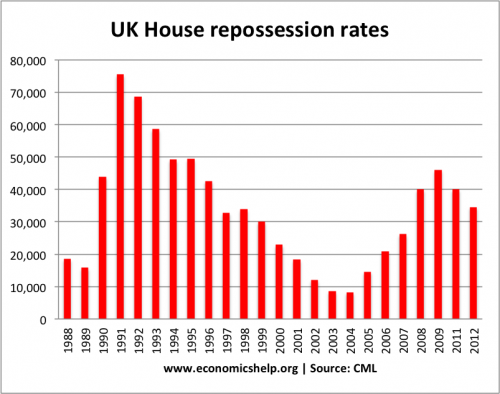
This repossession rate of 0.07% is significantly lower than the last housing bust and recession of 1991-92. In that period, the repossession rate peaked at 0.7% of homes.
Why is repossession rate low during credit crunch?
Low interest rates. The main difference between the 1991 crash and the great recession 2008-13 is the difference in interest rates. In 1992, the government increased interest rates to 15% in an attempt to reduce inflation. Unsurprisingly, these high interest rates caused many homeowners to be unable to afford mortgage repayments, and so the repossession rate increased. In 2013, we have had a period of very low interest rates since March 2009. Base rates are 0.5%. Homeowners on tracker mortgages are facing very low mortgage payments. Fixed rate mortgages are still very low compared to previous years.
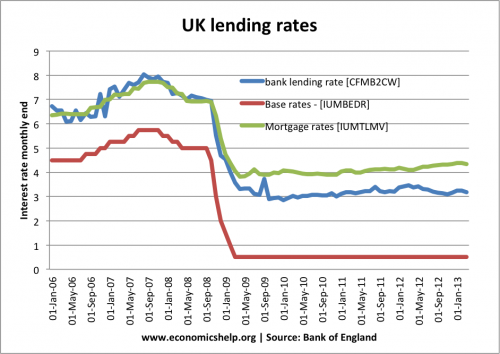
Even though bank lending rates haven’t fallen as much as base rates, mortgage payments are relatively low, and more attractive than renting.
Slightly lower unemployment. UK unemployment in 2012 was just under 8%, compared to 10% in 2012. However, real wages have been falling.
Is the UK housing market at risk from rising interest rates?
With interest rates at 0.5%, there could be a substantial shock to the market if interest rates rose significantly, especially for those on variable mortgages.
- However, in the past few years, a shortage of credit has limited the number of first time buyers able to buy a house.
- Also, if base rates rose to 5%, mortgage lending rates wouldn’t rise quite as much, as banks didn’t pass on full rate cut to customers. Some would be temporarily protected by fixed rate mortgages.
However, if interest rates rose to 5% or more, then it is most likely we would increase the rate of repossession.
Though there is no immediate sign of rising interest rates. It depends how quickly and how much interest rates rise. On the positive side, rising interest rates would indicate economic growth and rising real wages.
UK House prices
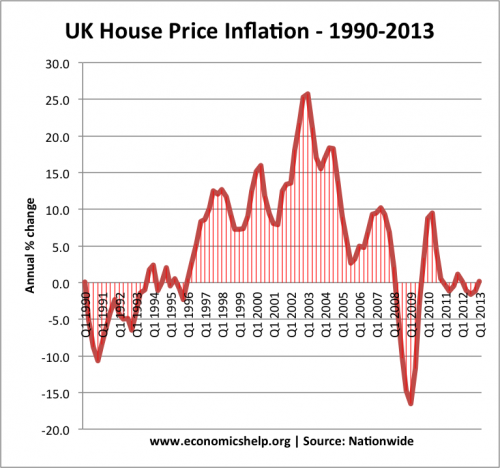
Low repossession rates have been a factor in stabilising house price falls. House prices have fallen at a slower rate than in the early 1990s. See house price stats
Repossession rates in the UK have been substantially lower than other countries, such as US and Ireland. Repossession and foreclosure rates in the US were a major factor in the cause of the credit crunch.
In the Future, repossessions rise because the UK recession will cause unemployment. On the other hand interest rate cuts will help homeowners meet mortgage payments. Interest rates (at 4.5%) are much lower than in the last housing slump.
Rate of Mortgage Repossession in the UK
| Period | 1 | 2 | 3 |
| Mortgages | Properties | Properties | |
| outstanding, | taken into | taken into | |
| end period | possession | possession | |
| in period | in period | ||
| number | number | % all loans | |
| 1972 | 4,770,000 | 1,760 | 0.04 |
| 1973 | 4,862,000 | 1,220 | 0.03 |
| 1974 | 4,910,000 | 3,290 | 0.07 |
| 1975 | 5,076,000 | 4,870 | 0.10 |
| 1976 | 5,322,000 | 4,950 | 0.09 |
| 1977 | 5,582,000 | 4,680 | 0.08 |
| 1978 | 5,896,000 | 4,130 | 0.07 |
| 1979 | 6,058,000 | 2,910 | 0.05 |
| 1980 | 6,210,000 | 3,480 | 0.06 |
| 1981 | 6,336,000 | 4,870 | 0.08 |
| 1982 | 6,518,000 | 6,900 | 0.11 |
| 1983 | 6,846,000 | 8,400 | 0.12 |
| 1984 | 7,313,000 | 12,400 | 0.17 |
| 1985 | 7,717,000 | 19,300 | 0.25 |
| 1986 | 8,138,000 | 24,100 | 0.30 |
| 1987 | 8,283,000 | 26,400 | 0.32 |
| 1988 | 8,564,000 | 18,500 | 0.22 |
| 1989 | 9,125,000 | 15,800 | 0.17 |
| 1990 | 9,415,000 | 43,900 | 0.47 |
| 1991 | 9,815,000 | 75,500 | 0.77 |
| 1992 | 9,922,000 | 68,600 | 0.69 |
| 1993 | 10,137,000 | 58,600 | 0.58 |
| 1994 | 10,410,000 | 49,200 | 0.47 |
| 1995 | 10,521,000 | 49,400 | 0.47 |
| 1996 | 10,637,000 | 42,600 | 0.40 |
| 1997 | 10,738,000 | 32,800 | 0.31 |
| 1998 | 10,821,000 | 33,900 | 0.31 |
| 1999 | 10,982,000 | 30,000 | 0.27 |
| 2000 | 11,173,000 | 22,900 | 0.20 |
| 2001 | 11,247,000 | 18,300 | 0.16 |
| 2002 | 11,364,000 | 12,000 | 0.11 |
| 2003 | 11,529,000 | 8,500 | 0.07 |
| 2004 | 11,511,000 | 8,200 | 0.07 |
| 2005 | 11,604,000 | 14,600 | 0.13 |
| 2006 | 11,742,000 | 20,900 | 0.18 |
| 2007 | 11,822,000 | 26,200 | 0.22 |
| 2008 | 11,300,000 | 40,000 | 0.36 |
| 2009 | 11,300,000 | 46,000 | 0.41 |
| 2011 | 11,300,000 | 40,000 est. | 0.36 |
| 2012 | 11,300,000 | 34,583 |
Note: The number of mortgage arrears is higher than repossessions. People can fall into arrears without having their home repossesed.
Sources for data
home repossession levels Guardian
Repossession help at Shelter
Thank you for answering my question!
Hey Tejvan,
I know what you mean, Mortgage default is a reality faced by many homeowners in the face of inflation and rising interest rates. It is a cause of worry because being unable to make mortgage payments on time could lead to foreclosure or loss of the home for the borrower.
Regards
– Paul Harvey @ http://repossession1.com
Wow what happened to UK in 1992? That’s a lot of reposessions!
With interest rates of 15% and a recession, it’s unsurprising. My mortgage payments are £450 a month, but in 1992, it would have been around £1,500