US Fiscal Cliff Explained

One of the most talked about issues in US politics is the US fiscal cliff.

The fiscal cliff refers to the situation at the end of 2012, where a series of tax increases and spending cuts (worth $600bn)  are due to come into force automatically. This amounts to  This will reduce the budget deficit, but cause lower growth. The alternative is to reject these planned budget cuts and allow the deficit to continue to grow. This will allow stronger economic growth, but leave the debt issue unchallenged.

A complicating factor for US politics is the debt ceiling. This is the legal amount by how much the government can borrow. The debt ceiling can be raised, but it has to go through the Senate to be voted on. This gives scope for political wrangling and efforts to push for some favoured spending cuts in return for allowing debt ceiling to be raised.

The debt ceiling was raised on January 30, 2012, to a new high of $16.394 trillion.

Read more

Why Government Debt Forecasts were wrong

One feature of the recent crisis has been the degree to which governments underestimated the forecast rise in government borrowing. The IMF produced a report which looked at forecast debt from 2007, and what debt actually was three years later. In ten selected countries, the increase in the gross debt ratio 31.8

  • 2007 forecast for debt in 2010 – 58.8% of GDP.
  • Actual government debt in 2010 – 90.6% of GDP

To some extent, this reflects the wider failure to forecast the recession. As well as underestimating debt levels, governments proved widely optimistic on GDP and unemployment. However, the recession wasn’t the only reason for governments to underestimate debt levels. There were also failures to account for liabilities, such as hidden obligations to public corporations and Public private finance initiatives. This shows that many countries need to improve their fiscal transparency.

  • Fiscal transparency can be defined as the clarity, reliability, frequency, timeliness, and relevance of public fiscal reporting and the openness to the public of the government’s fiscal policy-making process.

Why Forecasts were Wrong

There was quite a degree of variability in why debt forecasts were wrong. For example, in the UK there was only a minor underestimation of its fiscal position (3.7% of GDP). Most of the UK’s higher than expected debt were a consequence of the unexpected recession and financial sector intervention.

Read more

Austerity will Increase UK’s debt burden

According to the National Institute for Economic and Social Research (Niesr), fiscal consolidation in the UK is likely to increase the UK’s debt burden. Or to put it in layman’s terms there will be ‘pain, but no gain’ They model the impact of fiscal consolidation in both ‘normal’ times (scenario 1)  and in the current …

Read more

Italian Debt Crisis

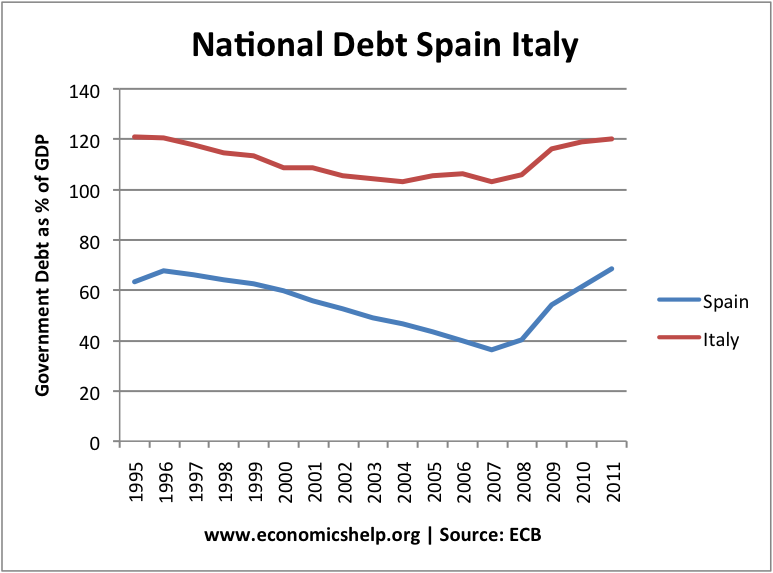
Italy has struggled to reduce national debt as a % of GDP since government debt has risen to over 100% of GDP in the late 1980s

National Debt Italy

  • Italy has the second highest public sector debt in Europe, after Greece. The IMF predict public sector debt of 123.4 % of GDP in 2012.
  • By 2013, Italian national debt is forecast to 123.8%

italy debt


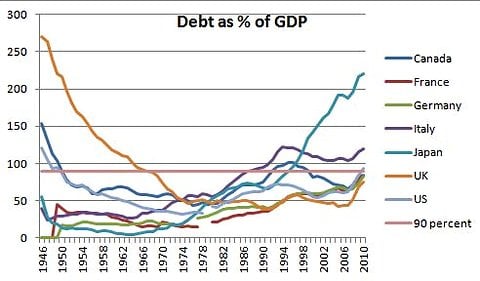
Historical Italian National Debt

italian-debt

Source: Debt and Growth in G7 (up until 1970s, Italian debt was below 50% of GDP. Source: Krugman)

Italian Budget Deficit

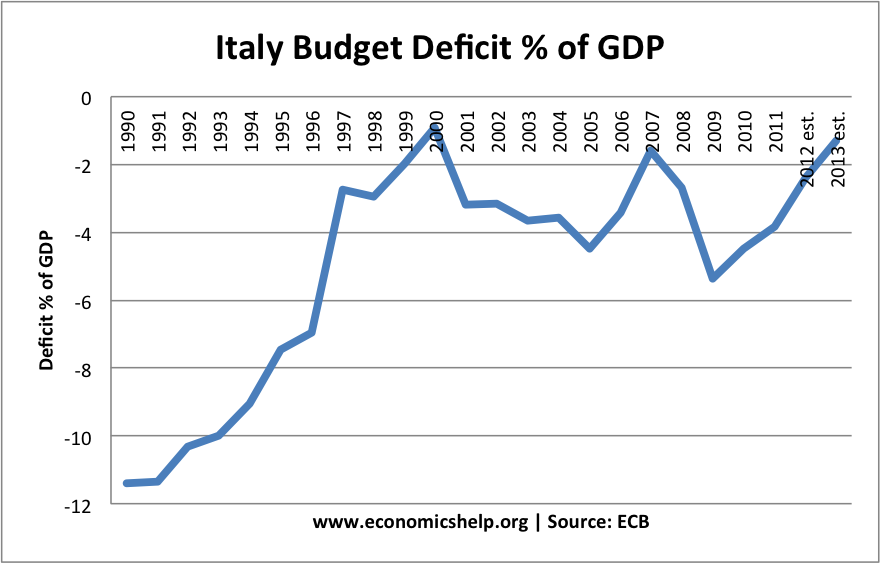
Despite the large total debt, Italy has a relatively low budget deficit as % of GDP.

italy-deficit
Italian Deficit. Source: ECB

The Estimated budget deficits for 2012 and 2013 have been revised. The IMF predict that the deficit will be 2.4% of GDP in 2012, above the government’s own target of 1.6% (Reuters)

Read more

Item added to cart.
0 items - £0.00