Evaluate the importance of managing aggregate demand (AD) to bring about a sustained reduction in the rate of unemployment in the UK economy.
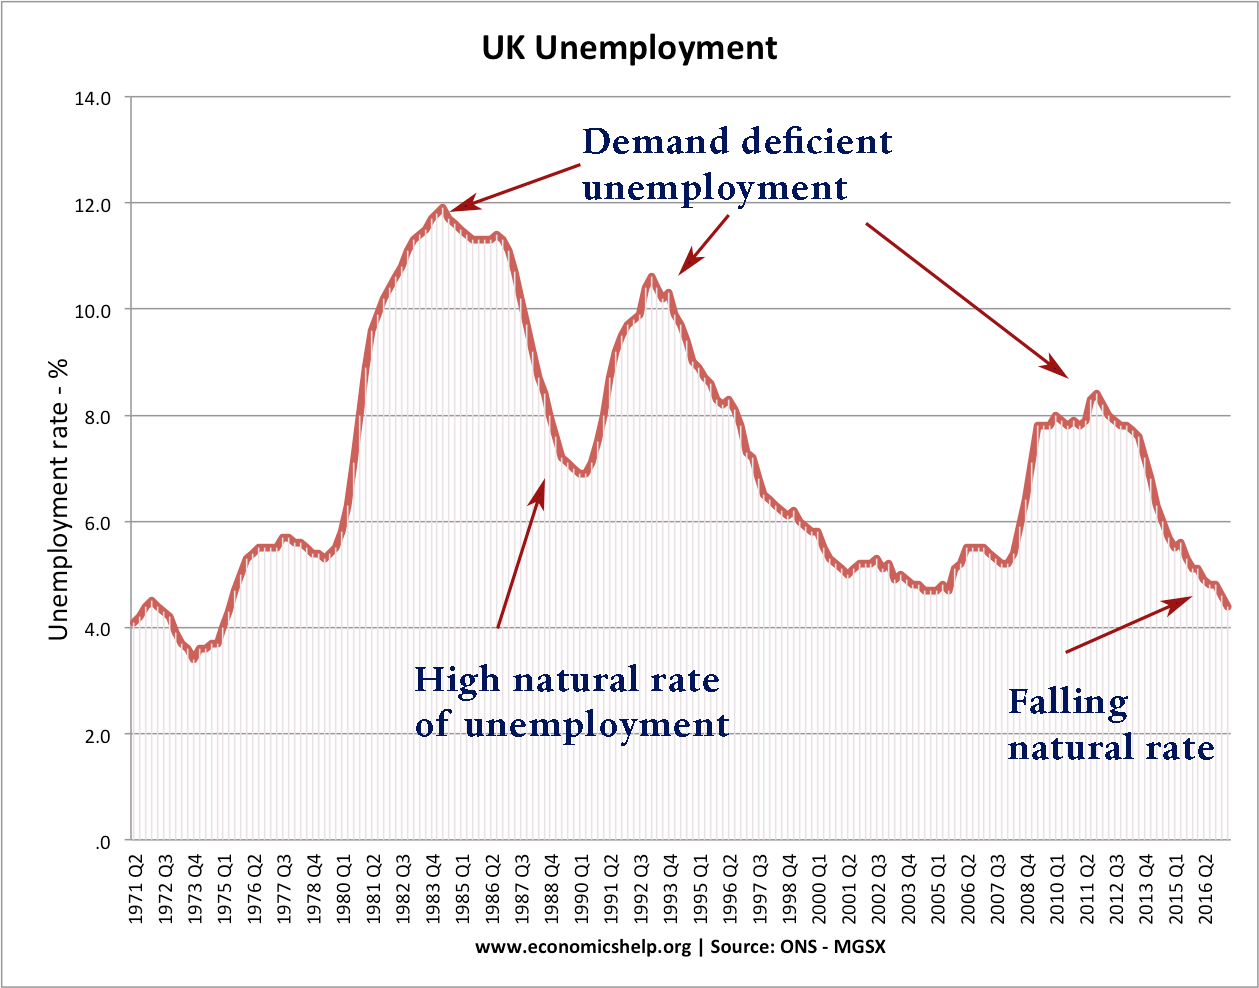
In 1992 Unemployment in the UK rose to 3 million. A significant part of this unemployment this was due to the recession of 1992.
In a recession, demand deficient unemployment will increase. This is because as firms close down they have to lay off workers. Other firms, may stay in business by not hiring new workers or laying off some existing workers. In a recession, we get a rise in unemployment due to deficiency of aggregate demand.
Increasing AD to increase employment
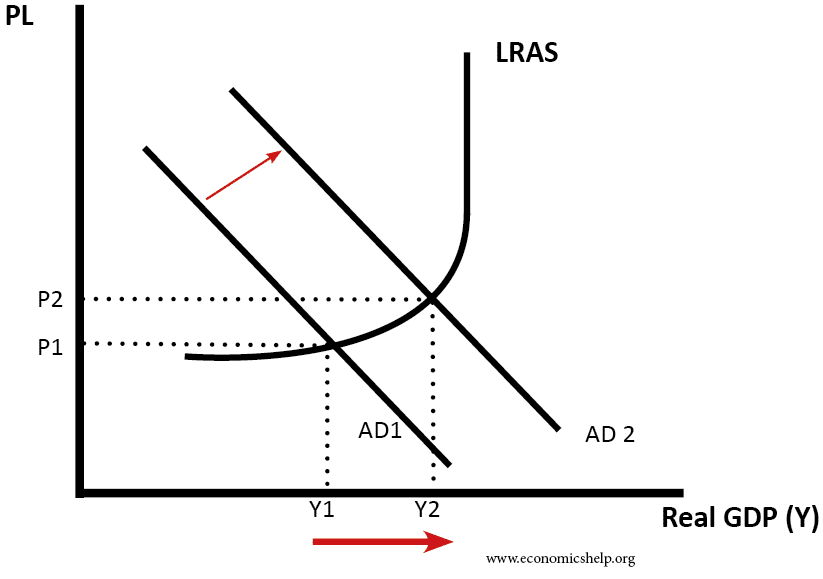
Therefore, in this case, it is important for the government to try and boost Aggregate Demand (AD) and increase the rate of economic growth. For example, the government could pursue expansionary fiscal policy; e.g – lower taxes and higher government spending. This will lead to an increase in AD and therefore, higher growth and jobs will be created reducing unemployment.
Governments may be reluctant to pursue expansionary fiscal policy because it will lead to higher borrowing.
Also, if AD increases too quickly it will cause inflation. Therefore, the growth may be unsustainable and the boom may lead to a bust. In this case, the job creation will only be temporary. Therefore, it is important to manage AD, so as to maintain stable, low inflationary growth. This will allow a sustained reduction in unemployment. To a large extent, this is what has happened in the UK since 1992. The MPC used monetary policy (changing interest rates) to enable low inflation and stable growth from 1992-2007. In 2009, the rise in unemployment caused the MPC to cut interest rates to 0.5% – in a bid to boost aggregate demand and create jobs.
AD is very important. However, there are many other types of unemployment which will not be reduced through demand management.
These include:
- Frictional unemployment (looking between jobs)
- Structural unemployment. – People without the right skills for the labour market
- Geographical unemployment – a mismatch of skills throughout the country.
- Real wage unemployment – caused by wages being above equilibrium levels.
- disguised unemployment – when people are put on sickness benefits. (not counted in official JSA measure) See true level of unemployment in the UK
- Voluntary unemployment – when benefits are too high they encourage people to remain on benefits rather than work.
E.g. It is argued that if the EU experienced faster growth, unemployment will still remain a problem because of structural supply-side factors. Often know as the natural of unemployment. To achieve full employment it is necessary to use supply-side policies as well. Supply-side policies can include
- More flexible labour markets
- Retraining for the long-term unemployed
- Improved geographical mobility.
Related Essays:
Hey i believe that unemployemtn can be decreased with subsidies. If we all followed Senator Judis’ plans, this mess wouldn’t have occured.
I BELIEVE THAT UNEMPLOYMENT CAN BE DECREASED THRU GOV SPENDIN
also unemployment could be lower if we provided more tax incentives too work