Definition of oligopoly
An oligopoly is an industry dominated by a few large firms. For example, an industry with a five-firm concentration ratio of greater than 50% is considered an oligopoly.
Examples of oligopolies
Car industry – economies of scale have caused mergers so big multinationals dominate the market. The biggest car firms include Toyota, Hyundai, Ford, General Motors, VW.
- Petrol retail – see below.
- Pharmaceutical industry
- Coffee shop retail – Starbucks, Costa Coffee, Cafe Nero
- Newspapers – In the UK market share is dominated by tabloids Daily Mail, The Sun, The Mirror, The Star, Daily Express.
- Book retail – In the UK market share is dominated by Waterstones, Amazon and smaller firms like Blackwells.
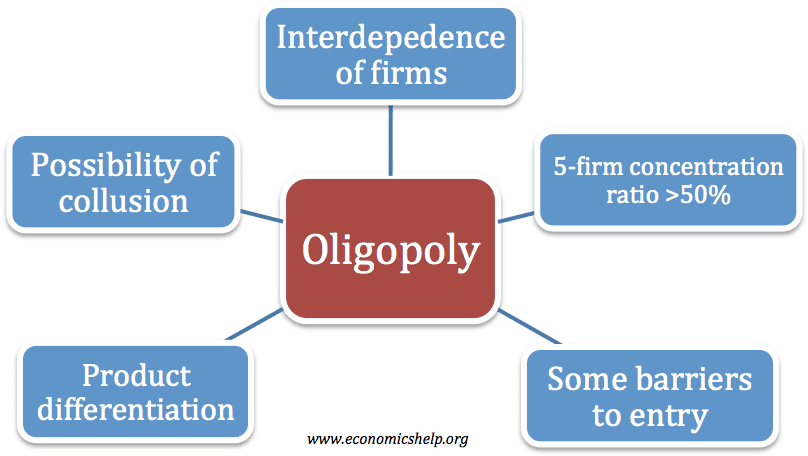
The main features of oligopoly
- An industry which is dominated by a few firms.
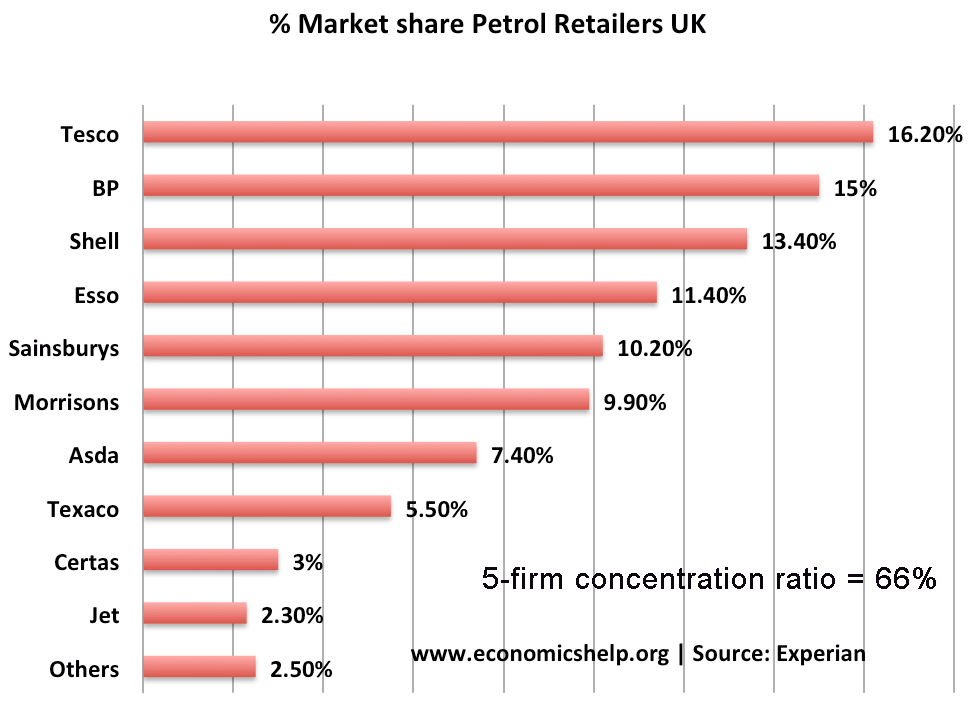
The UK definition of an oligopoly is a five-firm concentration ratio of more than 50% (this means the five biggest firms have more than 50% of the total market share) The above industry (UK petrol) is an example of an oligopoly. See also: Concentration ratios
- Interdependence of firms – companies will be affected by how other firms set price and output.
- Barriers to entry. In an oligopoly, there must be some barriers to entry to enable firms to gain a significant market share. These barriers to entry may include brand loyalty or economies of scale. However, barriers to entry are less than monopoly.
- Differentiated products. In an oligopoly, firms often compete on non-price competition. This makes advertising and the quality of the product are often important.
- Oligopoly is the most common market structure
How firms compete in oligopoly
There are different possible ways that firms in oligopoly will compete and behave this will depend upon:
- The objectives of the firms; e.g. profit maximisation or sales maximisation?
- The degree of contestability; i.e. barriers to entry.
- Government regulation.
There are different possible outcomes for oligopoly:
- Stable prices (e.g. through kinked demand curve) – firms concentrate on non-price competition.
- Price wars (competitive oligopoly)
- Collusion- leading to higher prices.
The kinked demand curve model
This model suggests that prices will be fairly stable and there is little incentive for firms to change prices. Therefore, firms compete using non-price competition methods.
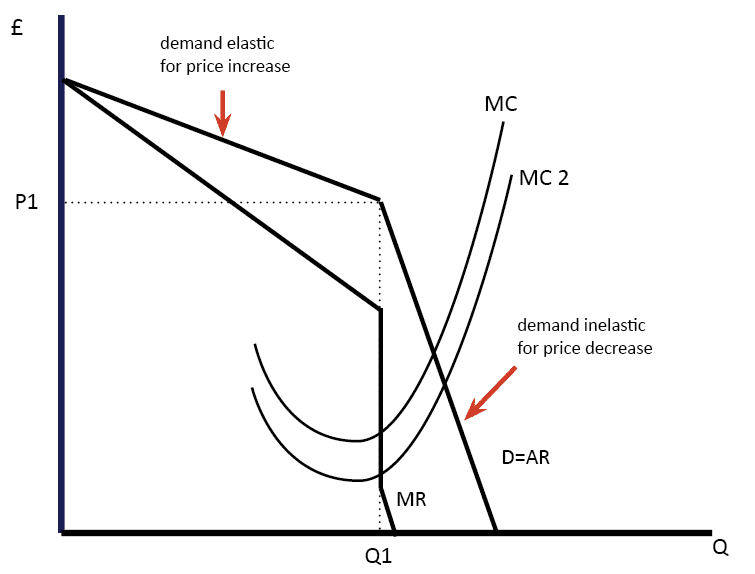
- This assumes that firms seek to maximise profits.
- If they increase the price, then they will lose a large share of the market because they become uncompetitive compared to other firms. Therefore demand is elastic for price increases.
- If firms cut price then they would gain a big increase in market share. However, it is unlikely that firms will allow this. Therefore other firms follow suit and cut-price as well. Therefore demand will only increase by a small amount. Therefore demand is inelastic for a price cut.
- Therefore this suggests that prices will be rigid in oligopoly
The diagram above suggests that a change in marginal cost still leads to the same price, because of the kinked demand curve. Profit maximisation occurs where MR = MC at Q1.
Evaluation of kinked demand curve
- In the real world, prices do change.
- Firms may not seek to maximise profits, but prefer to increase market share and so be willing to cut prices, even with inelastic demand.
- Some firms may have very strong brand loyalty and be able to increase the price without demand being very price elastic.
- The model doesn’t suggest how prices were arrived at in the first place.
Price wars
Firms in an oligopoly may still be very competitive on price, especially if they are seeking to increase market share. In some circumstances, we can see oligopolies where firms are seeking to cut prices and increase competitiveness.
A feature of many oligopolies is selective price wars. For example, supermarkets often compete on the price of some goods (bread/special offers) but set high prices for other goods, such as luxury cake.
Collusion
- Another possibility for firms in oligopoly is for them to collude on price and set profit maximising levels of output. This maximises profit for the industry.
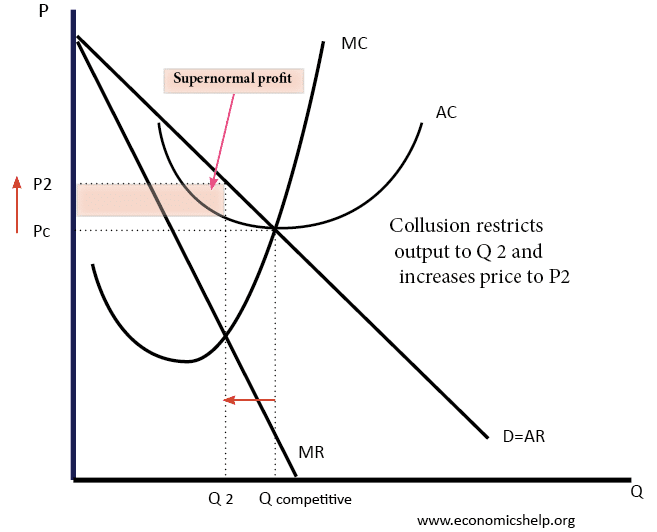
In the above example, the industry was initially competitive (Qc and Pc). However, if firms collude, they can agree to restrict industry supply to Q2, and increase the price to P2. This enables the industry to become more profitable. At Qc, firms made normal profit. But, if they can stick to their quotas and keep the price at P2, they make supernormal profit.
- Collusion is illegal, but tacit collusion may be hard to spot.
- For collusion to be effective, there need to be barriers to entry.
- A cartel is a formal collusive agreement. For example, OPEC is a cartel seeking to control the price of oil.
See: Collusion
Collusion and game theory
Game theory is looking at the decisions of firms based on the uncertainty of how other firms will react. It illustrates the concept of interdependence. For example, if a firm agrees to collude and set low output – it relies on the other firm sticking to the collusive agreement. If the firm restricts output (sets the High price), and then the other firm betrays its agreement (setting low price). The firm will be worse off.

- This shows different options. If the market is non-collusive, firms make £4m each.
- If they collude, they make £8m.
- But, if they are colluding there is an incentive for one of the firms to exceed quota and increase output. If a firm sets low price whilst the other sets a high price, their profit rises to £10m
Collusion and game theory is more complex if we add in the possibility of firms being fined by a government regulator.
Collusion is illegal and firms can be fined. Usually, the first firm that confesses to the regulator is protected from prosecution, so there is always an incentive to be the first to confess.
Related