Explaining Theories of Economic Growth

Different models of economic growth stress alternative causes of economic growth. The principal theories of economic growth include:

  1. Mercantilism – Wealth of a nation determined by the accumulation of gold and running trade surplus
  2. Classical theory – Adam Smith placed emphasis on the role of increasing returns to scale (economies of scale/specialisation)
  3. Neo-classical-theory – Growth based on supply-side factors such as labour productivity, size of the workforce, factor inputs.
  4. Endogenous growth theories – Rate of economic growth strongly influenced by human capital and rate of technological innovation.
  5. Keynesian demand-side – Keynes argued that aggregate demand could play a role in influencing economic growth in the short and medium-term. Though most growth theories ignore the role of aggregate demand, some economists argue recessions can cause hysteresis effects and lower long-term economic growth.
  6. Limits to growth – From an environmental perspective, some argue in the very long-term economic growth will be constrained by resource degradation and global warming. This means that economic growth may come to an end – reminiscent of Malthus theories.

Theories in more detail

Mercantilism

Popular at the start of the industrial revolution, Mercantilism isn’t really a theory of economic growth but argued that a country could be made better off by seeking to accumulate gold and increasing exports.

Classical model

Developed by Adam Smith in Wealth of Nations (1776), Smith argued there are several factors which enable increased economic growth

  1. Role of markets in determining supply and demand
  2. The productivity of labour. Smith argued income per capita was determined by “the state of the skill, dexterity, and judgment with which labour is applied in any nation” (Wealth of Nations I.6)
  3. Role of trade in enabling greater specialisation.
  4. Increasing returns to scale – e.g. specialisation we see in modern factories and the economies of scale of increased production

Ricardo and Malthus developed the classical model. This model assumed technological change was constant and increasing inputs could lead to diminishing returns. This led to the gloomy predictions of Malthus – that the population would grow faster than the world’s capacity to feed itself. Malthus under-predicted the capacity of technological improvements to increase food yields.

Neo-Classical model of Solow/Swan

The neo-classical theory of economic growth suggests that increasing capital or labour leads to diminishing returns. Therefore, increasing capital has only a temporary and limited impact on increasing the economic growth. As capital increases, the economy maintains its steady-state rate of economic growth.

To increase the rate of economic growth in the Solow/Swan model we need:

  • An increase in proportion of GDP that is invested – however, this is limited as higher proportion of investment leads to diminishing returns and convergence on the steady-state of growth
  • Technological progress which increases productivity of capital/labour

Read more

Social efficiency

tax-negative-externality-pigovian-tax

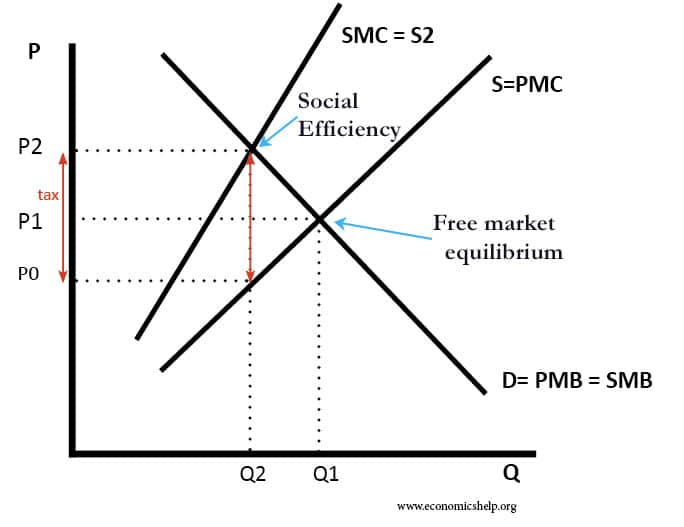
Definition of social efficiency. This is the optimal distribution of resources in society, taking into account all external costs and benefits as well as the internal costs and benefits. Social efficiency occurs at an output where Marginal Social Benefit (MSB) = Marginal Social Cost (MSC). Social efficiency is closely related to the concept of Pareto …

Read more

Investment and the Rate of Interest

mec-investment-cut-interest-rates

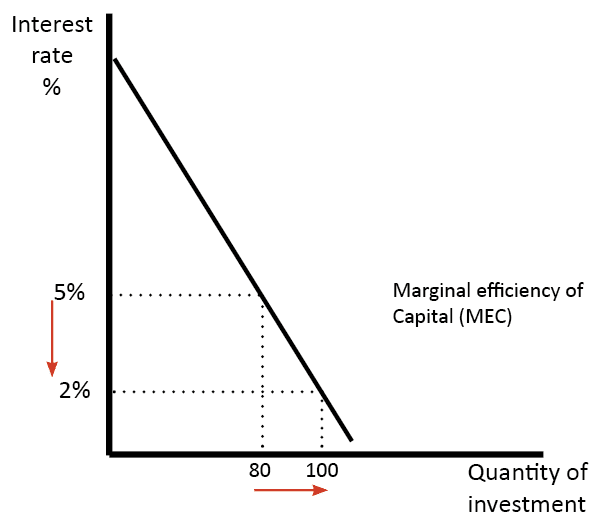
An explanation of how the rate of interest influences the level of investment in the economy. Typically, higher interest rates reduce investment, because higher rates increase the cost of borrowing and require investment to have a higher rate of return to be profitable. Private investment is an increase in the capital stock such as buying …

Read more

Pros and cons of socialism

democratic-socialism-pros-cons

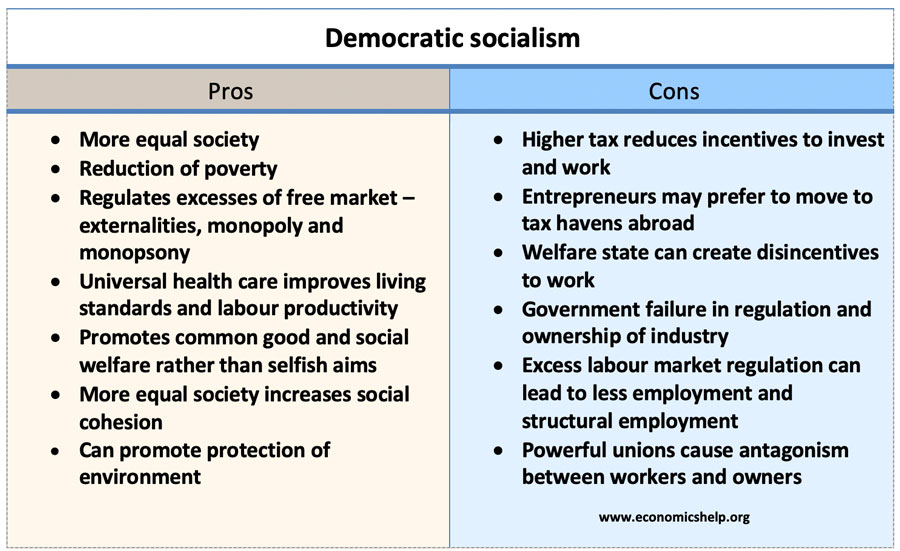
There are different forms of socialism but for this blog will use the form of democratic socialism advocated by Socialist parties in Western Europe. For example, Nordic countries where government spending is between 40-50% of GDP. This brand of socialism believes in: Redistribution of income and wealth through a progressive tax system and welfare state. …

Read more

Environmental Kuznets curve

kuznets-environment

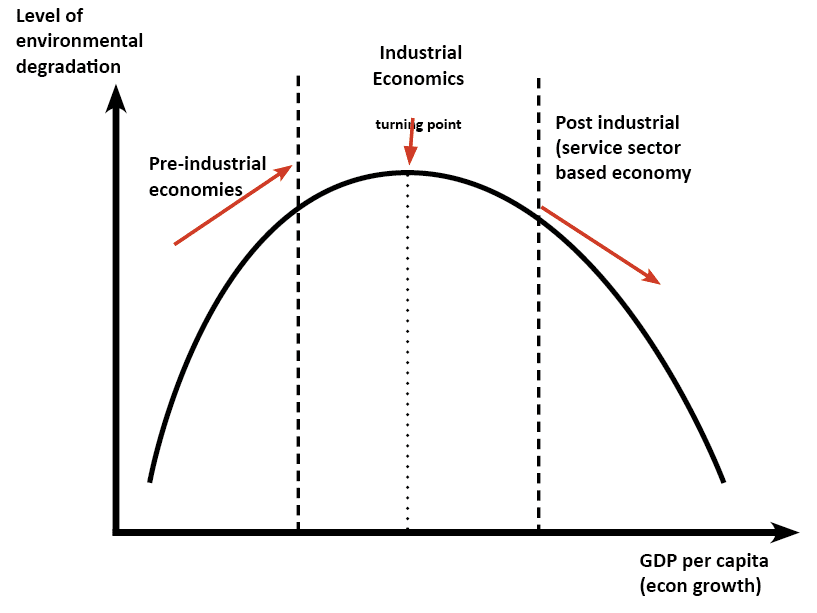
Definition: The environmental Kuznets curve suggests that economic development initially leads to a deterioration in the environment, but after a certain level of economic growth, a society begins to improve its relationship with the environment and levels of environmental degradation reduces. From a very simplistic viewpoint, it can suggest that economic growth is good for …

Read more

Supernormal Profits

monopoly-diagram

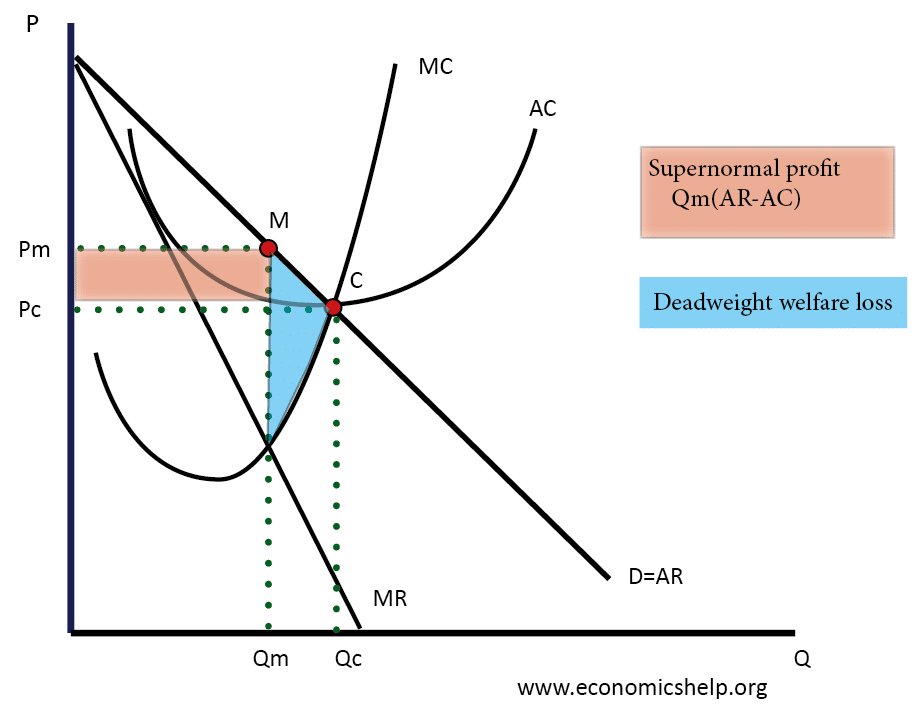
Supernormal profit is all the excess profit a firm makes above the minimum return necessary to keep a firm in business. Supernormal profit is calculated by Total Revenue – Total Costs (where total cost includes all fixed and variable costs, plus minimum income necessary for the owner to be happy in that business.) Normal profit …

Read more

Diagrams for Supply and Demand

rise-in-supply-fall-demand-arrows

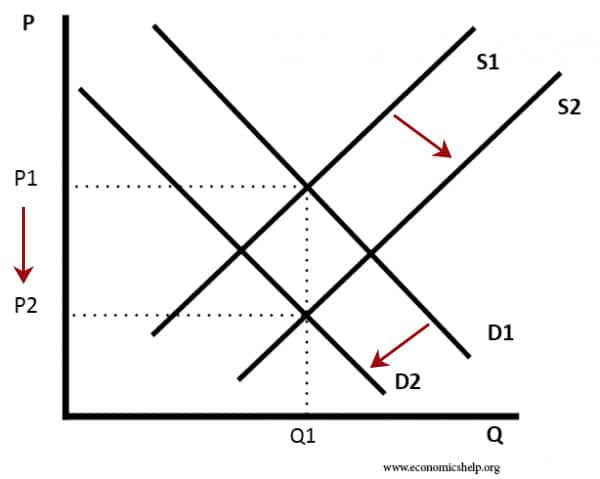
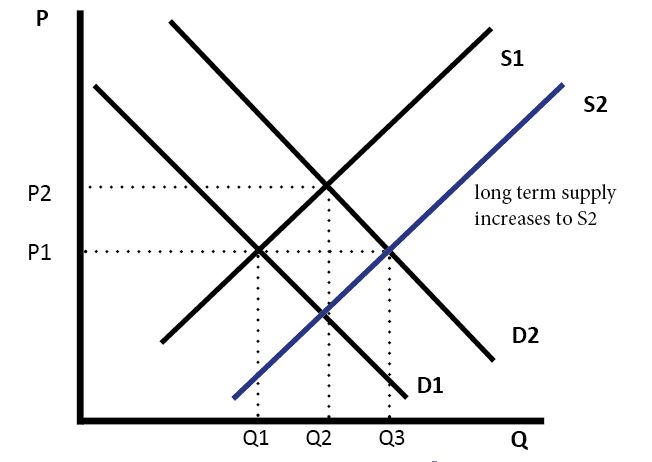
This is a collection of diagrams for supply and demand. It is mainly for my benefit, so when creating a post, like the price of tea (or when I’m teaching online) I can easily find a suitable diagram to illustrate what is happening.

s=d

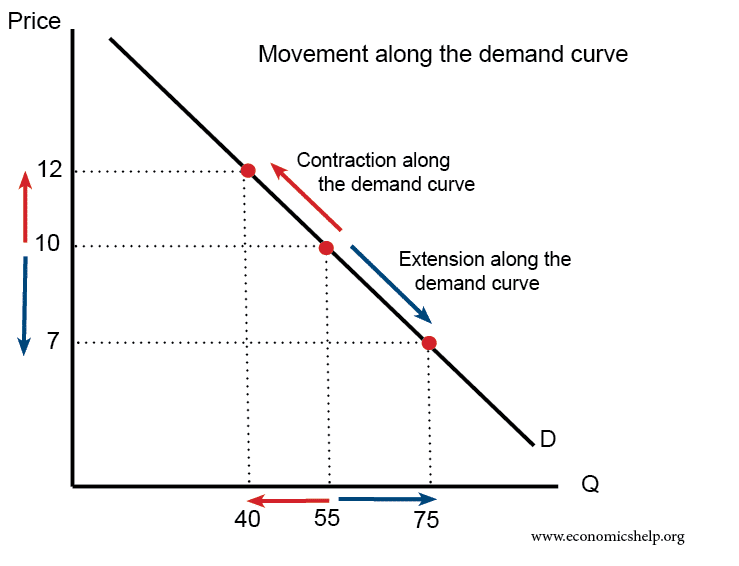
Demand curve

  •   movement-along-demand A contraction on the demand curve is due to higher price leading to lower demand
  • An extension on the demand curve is due to lower price leading to higher demand.

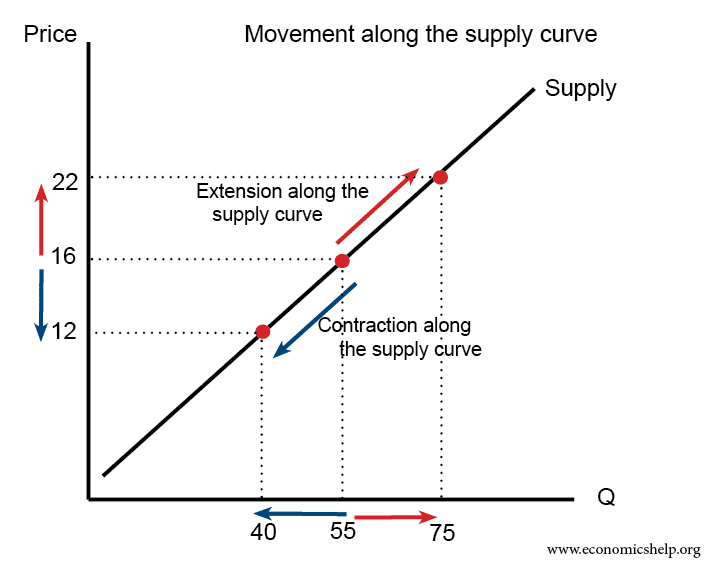
The supply curve

movement-along-demand

  • A higher price causes an extension along the supply curve (more is supplied)
  • A lower price causes a contraction along the supply curve (less is supplied)

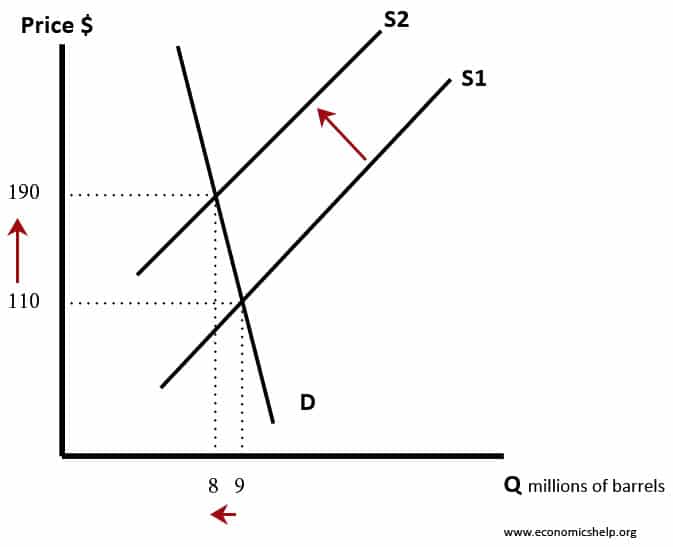
Supply Shifts to the left

fall-supply-oil-price-ar

In this diagram the supply curve shifts to the left. It leads to a higher price and fall in quantity demand. The supply curve may shift to the left because of:

  • Higher costs of production
  • Higher taxes
  • Fall in productivity

Supply and Demand Shift Right


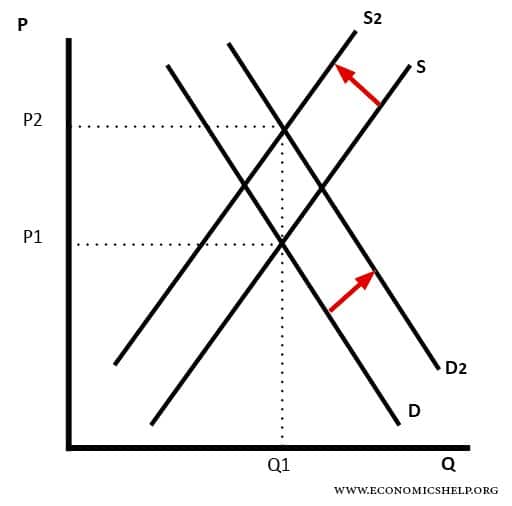
In this diagram, supply and demand have shifted to the right. This has led an increase in quantity (Q1 to Q2) but price has stayed the same.

It is possible, that if there is an increase in demand (D1 to D2) this encourages firms to produce more and so supply increases as well.

Diagram showing Increase in Price

rise-in-price

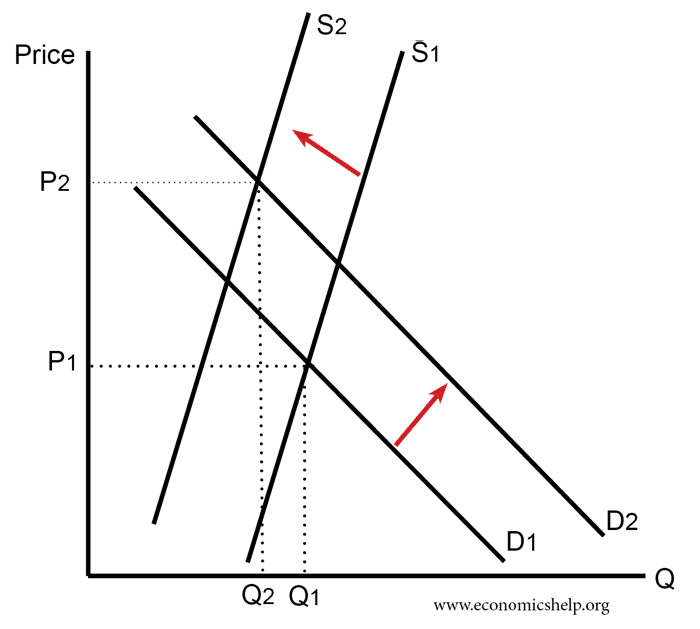
In this diagram, we have rising demand (D1 to D2) but also a fall in supply. The effect is to cause a large rise in price.

For example, if we run out of oil, supply will fall. However, economic growth means demand continues to rise.

Increase in Demand

increase-in-demand

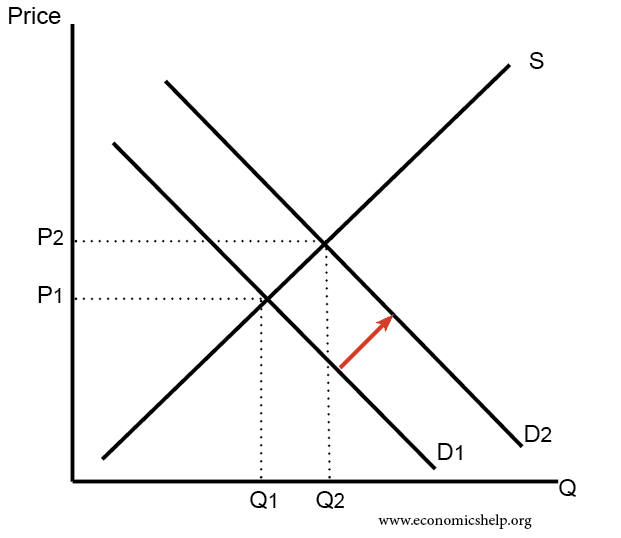
An increase in demand leads to higher price and higher quantity.

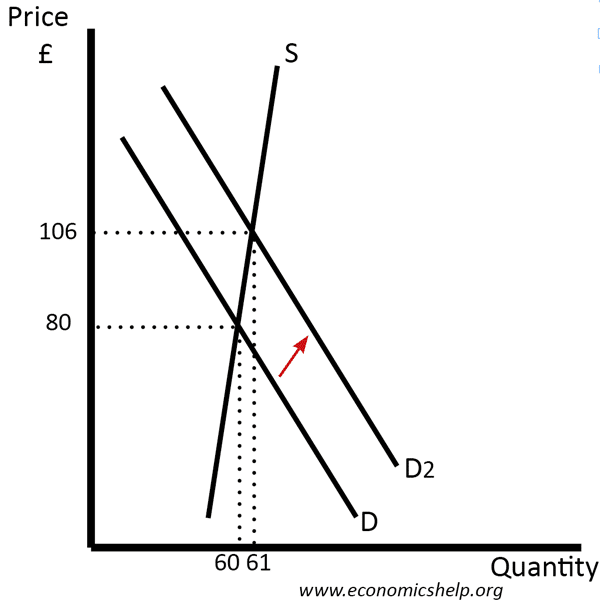
Increase in demand with inelastic supply

inelastic-supply-rise-in-demand

Read more

Top 10 British Banks

In recent years, the British Banking system has become highly concentrated due to the wave of mergers following the credit crunch. Top 5 British Owned banks Bank Market value (£bn) As of October 2013 Assets (£bn) As of 31 March 2017 1. HSBC 126 1,936 2. Lloyds Banking Group (Bank of Scotland/Halifax) 53.5 817 3. …

Read more

Item added to cart.
0 items - £0.00