
The UK national debt is currently £2.9 trillion or 93.8% of GDP (21 May 2026). The public sector debt is the total amount of money the British government owes to the private sector and other purchasers of UK gilts (e.g. Bank of England).
- The OBR have forecast substantial rises in UK debt over the coming decade because of demographic factors, putting strain on UK spending.
- Source: [1. ONS public sector finances,- HF6X] (page updated 21 May 2026)

Source: ONS debt as % of GDP – HF6X | PUSF – public sector finances at ONS
Note: Revised down. In July 2023, ONS calculated debt at over 100% of GDP, but this has been significantly revised down. Debt lower than previous releases.
Reasons for Rising national debt
- Crisis Spending. Enables the government to spend more during periods of national crisis, e.g wars, pandemics, and recessions.
- Recession In a recession, the government will automatically receive lower tax revenues (less VAT and income tax) and will have to spend more on benefits (e.g. more unemployment benefits). This causes a cyclical rise in debt.
- Fiscal Policy Extra government borrowing during a recession can help provide fiscal stimulus to promote economic recovery. By borrowing and then spending more, the government is injecting demand into the economy and this can help to reduce unemployment.
- Political Pressures. Political pressures to cut taxes, increase spending make borrowing more politically appealing
- Spending commitments. UK welfare budget is rising because of growing number of pensioners, and rise in health-related benefits.
- Investment The government borrow to finance public investment projects that can hopefully lead to higher growth in the future.
Forecast for the National debt?
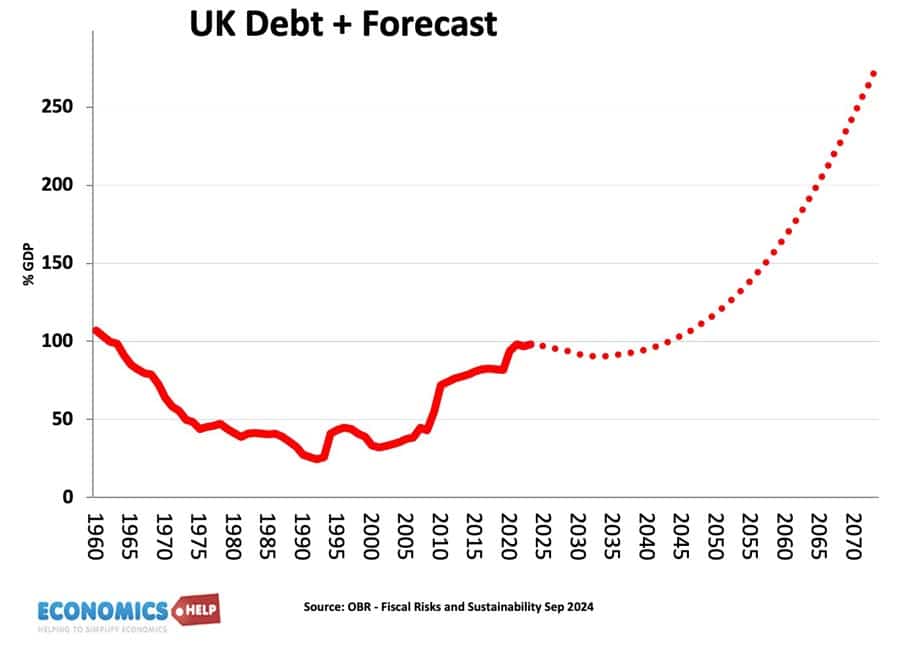
Source: Fiscal risks and sustainability – OBR – Economic and Fiscal Outlook Oct 2024
The OBR have forecast that, on our given trajectory, UK public sector debt could reach 350% of GDP within 50 years. The pessimistic outlook for national debt is made because:
- An ageing population and demographic changes will put increased pressure on government spending, notably health care and pension spending.
- A smaller working population will limit UK’s productive capacity.
- Stress on finances from geopolitical events, such as frostier relations with China, Russia and the Middle East.
- Higher energy prices
- Costs of climate change.
- Declining tax revenues from petrol in a decarbonising economy.
- Low productivity growth of UK since the financial crash of 2009
- Recent boost to debt from the financial crisis and one-off cost of Coronovirus pandemic, which cut tax revenues and required government support for lockdown measures.
UK debt in context
Predicting debt for the next 50 years is difficult since we don’t know what kind of productivity improvements may come, e.g. continued gains in renewable energy may reduce the burden of higher oil and gas prices. Equally, the costs of environmental change could be worse.
History of the national debt

Main article: History of UK national debt
UK national debt since 1900
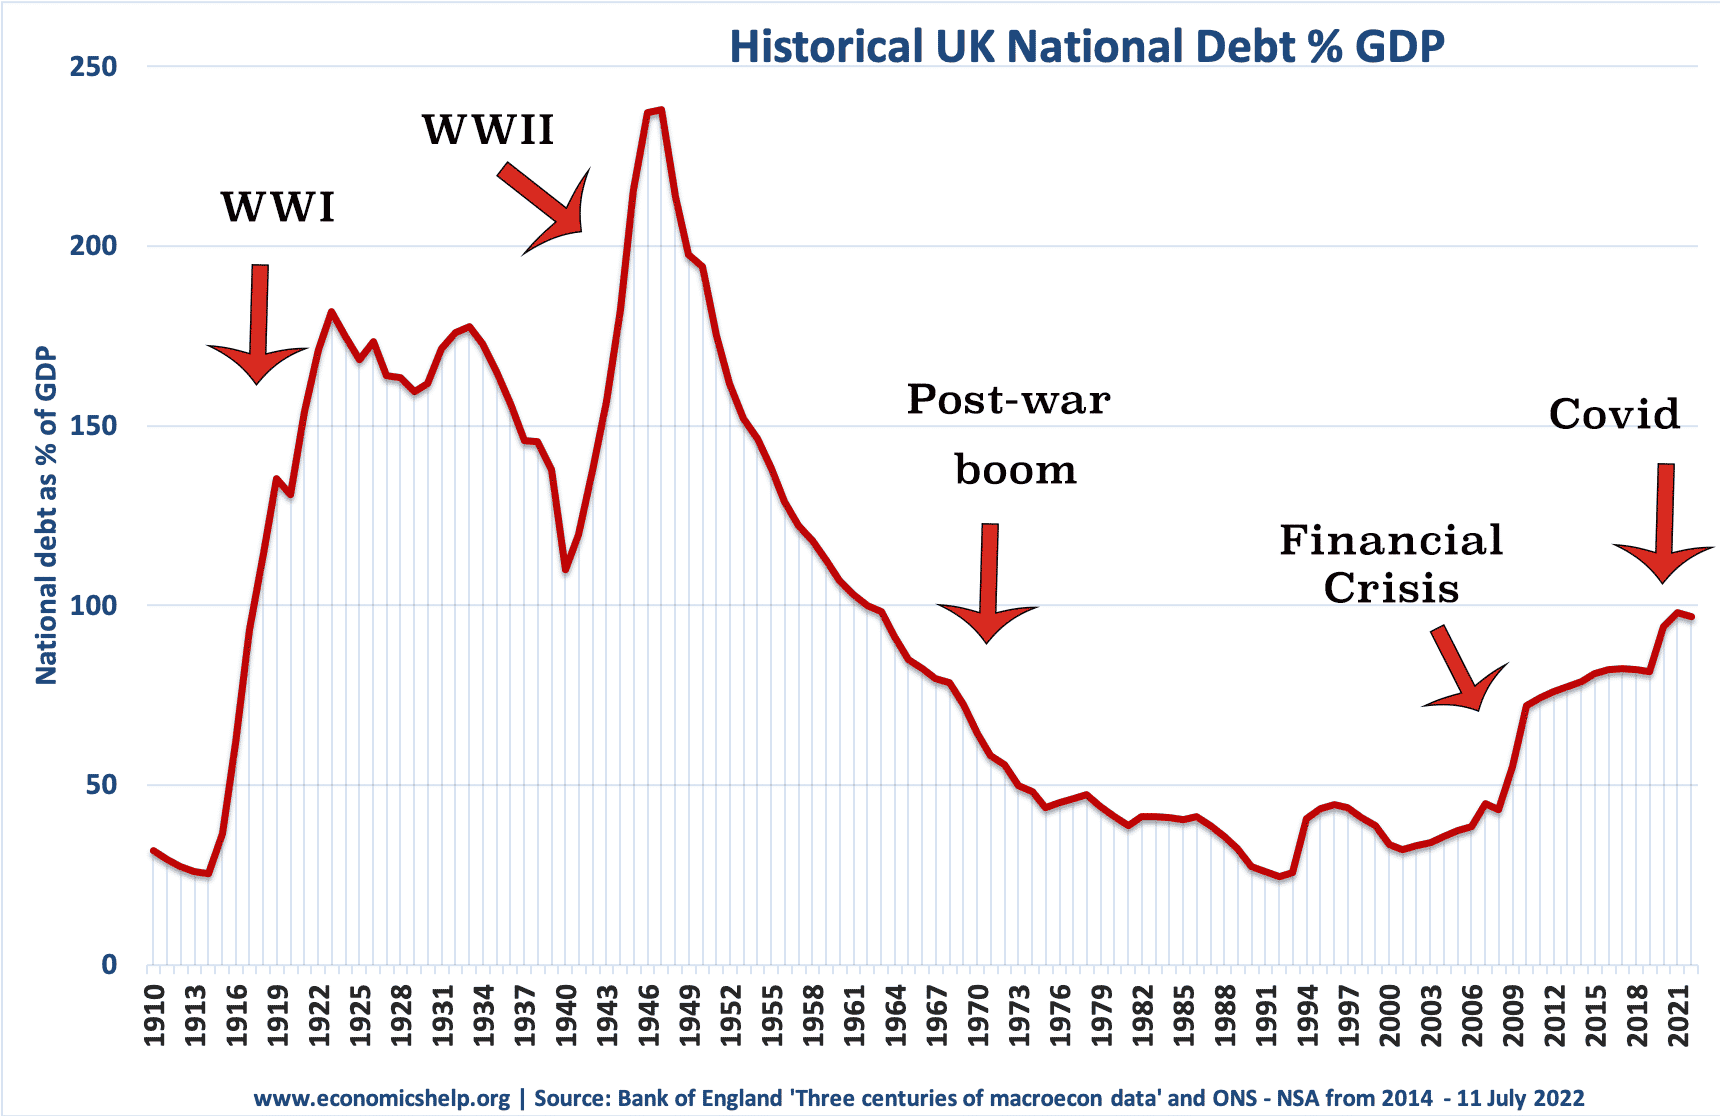
Source: Reinhart, Camen M. and Kenneth S. Rogoff, “From Financial Crash to Debt Crisis,” NBER Working Paper 15795, March 2010. and OBR from 2010.
These graphs show that government debt as a % of GDP has been much higher in the past. Notably in the aftermath of the two world wars. This suggests that current UK debt is manageable compared to the early 1950s. (note, even with a national debt of 200% of GDP in the 1950s, UK avoided default and even managed to set up the welfare state and NHS.
The post-war levels of national debt suggest that high debt levels are not incompatible with rising living standards and high economic growth.
- The reduction in debt as a % of GDP 1950-1980 was primarily due to a prolonged period of economic growth. See: how the UK reduced debt in the post-war period
- This contrasts with the experience of the UK in the 1920s when in the post First World War, the UK adopted austerity policies (and high exchange rate) but failed to reduce debt to GDP. Debt in Post-First World War period.
Debt reduction and growth
Budget deficit – annual borrowing
This is the amount the government has to borrow per year.
- Government borrowing in the financial year to December 2024 was £129.9 billion
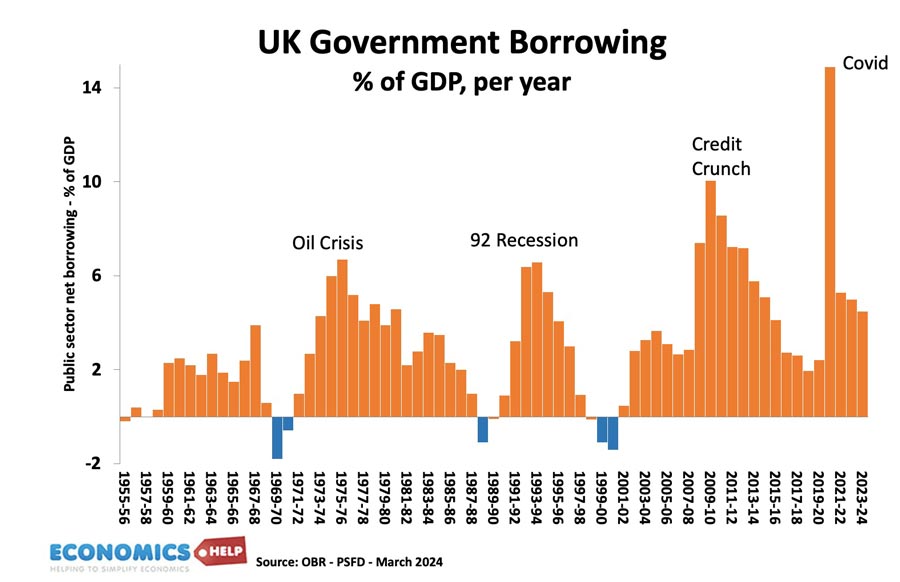
Annual borrowing since 1950. Figures for 2023-24 are forecasts (and rather optimistic!)
Debt and bond yields
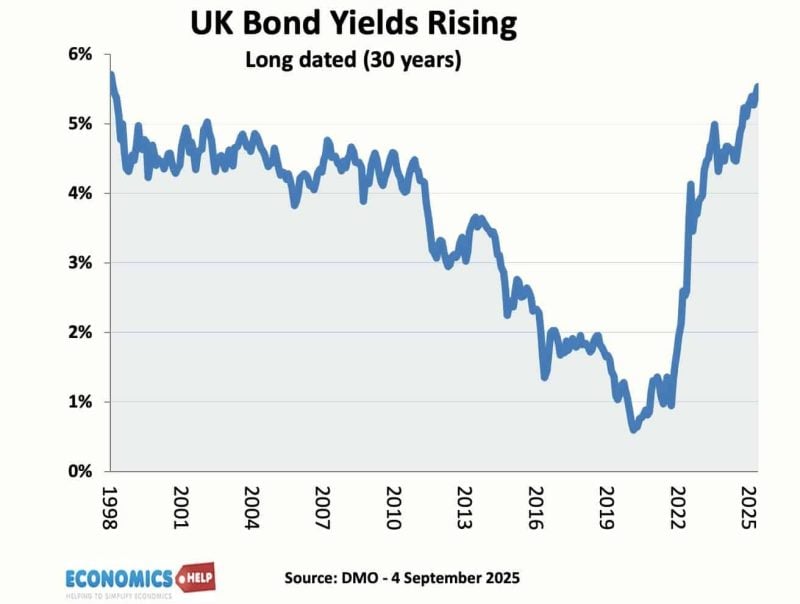
Bond yields are the interest that the government pay bond/gilt holders. It reflects the cost of borrowing for the government. Lower bond yields reduce the cost of government borrowing.
Between 2007 and 2020, UK bond yields fell. However since 2021, bond yields have risen due to:
- Higher inflation
- Higher interest rates (to try and reduce inflation_
- A premium for risk of UK default (or partial default through inflation)
Cost of Interest Payments on National Debt

The cost of National debt is the interest the government has to pay on the bonds and gilts it sells. According to the OBR in 2025-26, total debt interest payments will be £126 billion. (3.5% of GDP). It is lower than in previous decades because of lower bond yields.
See also: UK Debt interest payments
The era of low interest rates post 1992 helped to reduce UK debt interest payments as a ratio of government revenue. However, with interest rates and borrowing increasing – debt interest cost have increased significantly in recent years. They have now become the 4th largest source of UK government spending.

Problems of National Debt
- Interest payments. The cost of paying interest on the government’s debt is very high. In 202/25 debt interest payments will be £126 billion a year (est 3.6% of GDP). Public sector debt interest payments will be the 4th highest department after social security, health and education.
- Higher taxes / lower spending in the future.
- Crowding out of private sector investment/spending.
- Set to get worse The structural deficit will only get worse as an ageing population places greater strain on the UK’s pension liabilities. (demographic time bomb)
- Higher rates. Potential of rising interest rates as markets become more reluctant to lend to the UK government.
- Inflationary pressures. If debt is financed by Bank of England creating money to buy gilts, there could be an increase in inflationary pressures over time.
However, government borrowing is not always as bad as people fear.
- Borrowing in a recession helps to offset a rise in private sector saving. Government borrowing helps maintain aggregate demand and prevents a fall in spending.
- In a liquidity trap and zero interest rates, governments can often borrow at very low rates for a long time (e.g. Japan and the UK) This is because people want to save and buy government bonds.
- Austerity measures (e.g. cutting spending and raising taxes) can lead to a decrease in economic growth and cause the deficit to remain the same % of GDP. Austerity measures and the economy | Timing of austerity
- Investment in infrastructure could help long-term performance of the economy
Who owns UK Debt?

The majority of UK debt used to be held by the UK private sector, in particular, UK insurance and pension funds. In recent years, the Bank of England has bought gilts taking its holding to 25% of UK public sector debt.

Source: DMO Debt Management Report 2022/23
- Overseas investors own about 28% of UK gilts (2023).
- The Asset Purchase Facility is purchases by the Bank of England as part of quantitive easing. This accounts for 26% of gilt holdings.
Total UK Debt – government + private
- Another way to examine UK debt is to look at both government debt and private debt combined.
- Total UK debt includes household sector debt, business sector debt, financial sector debt and government debt. This is over 500% of GDP. Total UK Debt
Private sector savings
 When considering government borrowing, it is important to place it in context. From 2007 to 2012, we have seen a sharp rise in private sector saving (UK savings ratio). The private sector has been seeking to reduce their debt levels and increase savings (e.g. buying government bonds). This increase in savings led to a sharp fall in private sector spending and investment. The increase in government borrowing is making use of this steep increase in private sector savings and helping to offset the fall in AD. see: Private and public sector borrowing
Comparison with other countries

Although 101% of GDP is high by recent UK standards, it is worth bearing in mind that other countries have a much bigger problem. Japan, for example, has a National debt of 250% (though confusingly Japan net debt is lower because of large assets), Italy is 135%. The US national debt is 123% of GDP. [See other countries debt].
How to reduce the debt to GDP ratio?
- Economic expansion which improves tax revenues and reduces spending on benefits like universal credit. The economic slowdown which has occurred since 2010 has pushed the UK into a period of slow economic growth – especially if we consider GDP per capita growth. Therefore the further squeeze on tax revenues has led to deficit-reduction targets being missed.
- Government spending cuts and tax increases (e.g. VAT) which improve public finances and deal with the structural deficit. The difficulty is the extent to which these spending cuts could reduce economic growth and hamper attempts to improve tax revenues. Some economists feel the timing of deficit consolidation is very important, and growth should come before fiscal consolidation.
- See: practical solutions to reducing debt without harming growth
Sectoral Balances
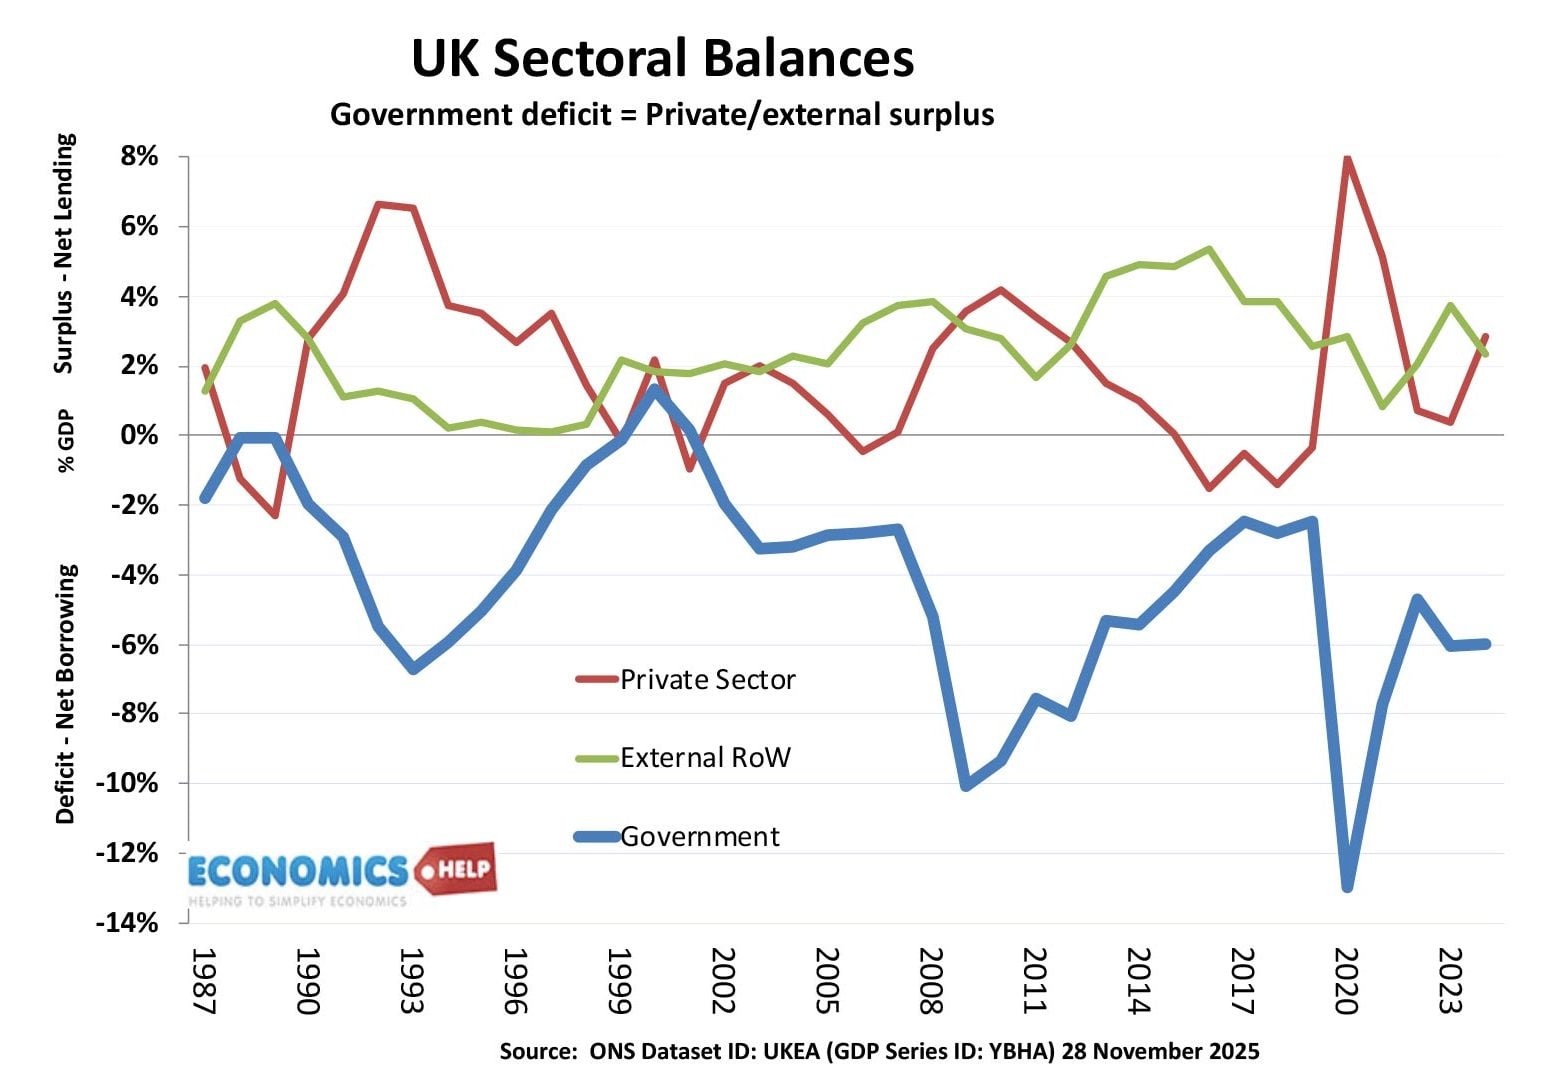
Government deficit is always matched by private sector or external surplus. For more explanation, see: Sectoral balances
Other countries debt
See also:
ONS stats on public sector debt
About The Author

“In August 2022, UK public sector net debt was £2,427.5 or around 96.6% of GDP).”
Only two and a half grand? :-/
Thanks for spotting. Small matter of missing billion. In August 2022, UK public sector net debt was £2,427.5 bn or around 96.6% of GDP
This is a somewhat tardy contribution. BUT – one problem with such diascussions is that they do tend to remain on the side of fincial/monetary/price equations.
Any discussion or use of increased debt in funding our present need for recovery surely must centre on the planned usage of debt. It increased if fore-planned and transparent in a political regime that has a real democratic mandate, then at the core must be an intention to use increased debt to fund a mixture of medium and long term real public projects that together could constitute a Keynesian style of positive intervention. Do not howl yet. Its true that Keynes himself would feel nauseus at this bare statement, if only because of the intricacies of his theory of money. BUT, whether increased debt can be considered a true burden when it is actually used to fund productive growth of industries and services under increasing levels of productivity (not measuring the latter primarily in labour productivity terms but at least attempting a bit of TFP calculation!) then what matters is sn astute period of national accounting.
Even old man Smith himself allowed for increased debt and did so in apologising for increased expenditure by the state in times of war (The Wealth of Nations 1776). we have suffered something that all media have labelled warlike buy without anything like the real asset and building destruction of material warfare at a world level. There is therefore a better chance of reinstating a policy of recovery by debt.
A major problem is that in most democratic capitalist nations debt proportions have been on the sporadic increase since 2008, certainly not just since the pandemic. In some of the very large and hitheto growing systems outside of Europe, Asia and the Anglophone nations debt has remained modest for several reasons – some do not have the status to borrow very freely or at low cost in either public or private sectors; in many important sectors growth really has been almost self-funding, not requiring debt; in all they have had lower covidity measured by cases per million, deaths per million and death/cases%, than the richer nations, for reasons that I have considered very extensively elsewhere, meaning that borrowing for short-term covidity was very small.
This backdrop means that electorates will be very wary indeed when any group of our present populist politicians begin to come out with borrowing/spending plans of this sort, even if they mange to be coherent in media delivery. They are often not. When the UK Labour Party in an earlier election fight against what were by then a group surrounding Boris Johnson and an increasingly rightest centre, the combination of a fairly incoherent Labour leadership under Jeremy Corbyn with a perfectly sensible and debatable economic plan from his major economic minister (John McDonald), never ever emerged as a power in the debate as it was seen as complex, non-populist, even threateneing more taxes, and requiring of too much in the way of best possible outcomes. The Tories cam in on a landslide and threaten to survive even the present gruesome turn of events.
So, the issue is far more one of political economy than of financial/public sector economics, for an appeal to realmproduction of real goods and services requires an older trust of democratic processes, the power of elections and or trusted regimes, it requires a public closeness of debate and policy formation that is both close in preparing the ground prior to public delivery and well-prepared for the subsequnet policy delivery process itself. This is where democracy is falling short of its old potential. It was alway built upon colonialism and exploitation, but it was also mostly forced to be transparent because large social classes were involved in political outcomes very directly through mass elections, local-government based active communities, and a media that could be held up to face the consequences of its own bias or ineptitude, at least more so than can be said at present.
And political economy is no technical matter, viewable through the equations of even the much modified neo-classical economics that we have inherited from the 1950s. It requires some dort of organic civil society. This sounds elitest and is dangerously back to the normative. I am sorry about that. But it can be seen with more sympathy. it is poossible through the political process to forward a 21st century New Deal in which major cpaitalist nations agree to a broad [pattern of interventionism in which the middle income nations ar3=e directly involved as private and public investors and traders. Growth in this latter group shall be far higher than that in the ‘mature industrial’ democratic capitalist nations for some time, assuming the absence of this Keynesian program. Assuming some greater collaboration the divergence would be lesser, the overall average performance would be greater, and there might be some movement for those nations who have considerably increased their levels of economic freedoms, to emerge as nations of greater cultural and political freedom. Old men and their narrow regimes need not last for too long, and a rising middle class is a wonderous thing.
Ok so we have moved an awful long way from the first comment on this long chain! But it might be worth revisiting those early comments, after all much has gone under the bridge since then and we are in greater rather than lesser trouble at a world level. I leave you with a terrible irony – in the long 1950s-1980s period when western economists and politicians were lecturing the 3rd world on what to do about their poverty and misery, when they werre very stringent with the then IMF regulations on who could lend what to wheom and who needed to up their exchange rates and so on, very little 3rd world development actually occured. The breakaway of the Newly Industrial Economies of East Asia was but a happy proportion, and the Chinese revovation was not even recognised by most analysts. Now the whole conception of a world of poverty has been massively interrupted, lower income nations are now under more influence, investment and trade from East Asian – especially China and Japan who were externally invisible in the 1970s – the third world really is shrinking, much more than in the earlier years of Cold War and rampant capitalism, the world is actually a lot better off. But still we are messing up.
Oh for a one handed economist !
Hi Everyone…
This discussion is the most important in the whole of our modern history. This is because the world is moving into a different era of work, capital and consumerism. The human race has never been down this path before, and it will change everything in the ‘near future’ ie within an economic time-scale of 20 to 50 years – which is within one working lifetime of an existing child.
The Point I shall TRY to make is… money and debt, as we currently understand it, will effectively CEASE TO EXIST. This is because the efficiency of production will tend towards 100% within the next 50 years…. please let me explain before you dismiss this as nonsense….
The whole concept of jobs/efficiency/debt is going to change EXPONENTIALLY. Companies employ people and own the means to production, competition increases efficiencies. This, for many people is the way capitalism should work, there are the owners of the capital and the workers. The money flows around, money base expands to meet the increase in efficiency (worker output per unit of capital), and all is well, (more or less).
However, a change… a massive change is coming. The workers who make the products and services will, within a time-scale of 20 to 50 years be replaced by ‘Smart Robots’…. and these will rise exponentially because they will manufacture themselves… 2, 4, 8, 16, 32…..then billions
This is a world transformation – no one will be able to hide from its reach – except the (few) very rich and very powerful. The Smart Robot will make the Smart Robot – this will lead to an exponential rise of robotic systems and Robotic ‘wealth creation’. In 50 years time very few people will have jobs as we know them today (people may choose to work, but that will be their choice). There will be plenty of wealth – but people will not be creating it. *We see this trend already… take UBA where their efficiency is massive…add in the driverless vehicle (there are already taxis without ANY driver in Arizona) and you have 98% efficiency.
Few people understand the capability of this new technology, and fewer see the transformation coming – think of the railroad and how it changed the world’s economies. Interestingly, it also became exponential as the railroad built the next bit of railroad… the Smart Robot will do exactly the same.
BUT – Who then owns these Robots? Who owns the ‘means to production’ and the many services? No one will answer this question, people say … but someone must own the capital … but WHY?
So, when we replace the ‘worker’… what happens to the standard economic theories? Does capital matter any more? If so, why when the Robots can make as much as the society needs without any help… do we need to consider who owns the capital? If just a ‘few’ own the capital, the rest of us are effectively enslaved ‘users’ without any say about a fair share out?
So, if the capital does not matter what happens to debt? Who cares what the debt is? Everyone can have whatever they want (subject to the planets resources), the questions will be about the SHARE OUT of the total world resources. Debt therefore will be meaningless, if you print more money, then it will go straight into inflation, as there is no middle man (work / capital / efficiency / output). If you borrow – what would you do with the money – you can’t use it to create any wealth as wealth production is 100% efficient already. If you spend you borrowed money, since the available resources are finite – this just inflates the prices of everything.
Work, Capital, Money & Debt become meaningless. To me this final outcome seems irresistible, all I am not sure about is the timescales… and can we create a sensible transition?
Your esteemed thoughts appreciated.
Thanks for reading.
CST
At the time of the Economic collapse 2007/ 2008 or near the end of that period in 2010 the Labour admionistration had actually started to pull out of recession – True or False ?
Round about 2010 there was a theory put about by an American University that if your Debt to GDP ratio rose above the arbnitrarty figure of 90% then your economy was doomed forever and many governments and the ECB in particular used this thesis to introduce harsh Austerity measures. This University theory was later debunked – True or False ?
If one looked at the UK’s Historicalk Debt to GDP ratio; at the time austerity was introduced; the Debt to GDP ratio was last at this 2010 level in 1966. Having lived in 1966 there was no massive economc requirement to reduce public spending at that time ie everything was fine. So was this “need” to take drastic action just all rubbish ?
thanks Brett
https://www.economicshelp.org/blog/153626/debt/was-austerity-necessary-in-2010/
https://www.economicshelp.org/blog/153619/economics/when-did-the-recovery-from-the-2009-recession-occur/
https://www.economicshelp.org/blog/7541/debt/does-government-debt-lead-to-lower-economic-growth/
One more question: if the BoE buys Government debt, where does it get the ‘money’ from to do this?
I assume it is Government that issues gilts not the BoE