Includes short-run aggregate supply (SRAS) and long-run aggregate supply (LRAS) and classical and Keynesian view of LRAS curves.
A simple macroeconomic equilibrium where AD = AS.
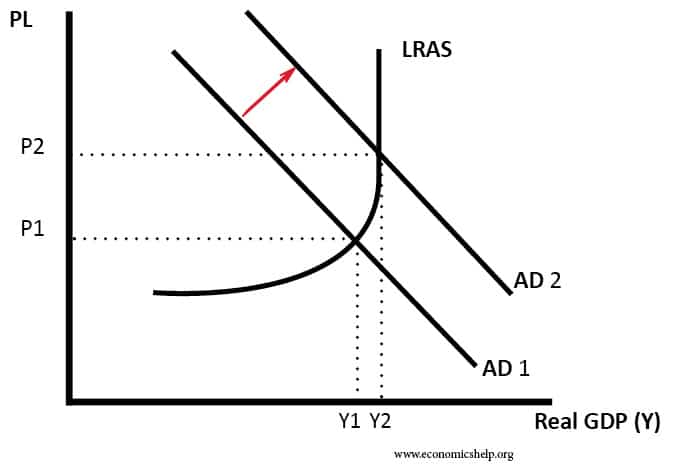
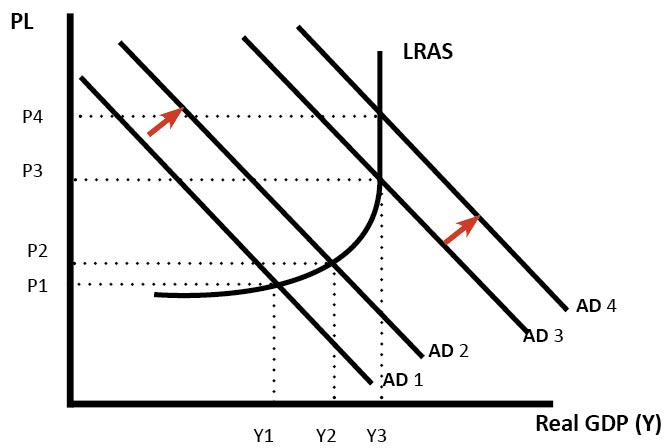
Increase in AD when economy is close to full capacity
This shows an increase in AD when the economy is close to full capacity, causing a significant rise in price level.
Increase in AD, when the economy is close to full capacity leads to increase in Price Level and only small increase in real GDP.
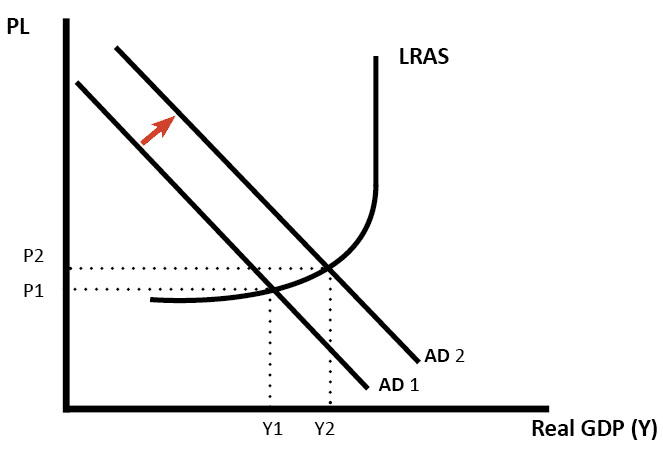
Increase in AD with spare capacity
In this diagram, the increase in AD causes a bigger percentage increase in real GDP and a smaller increase in price level.
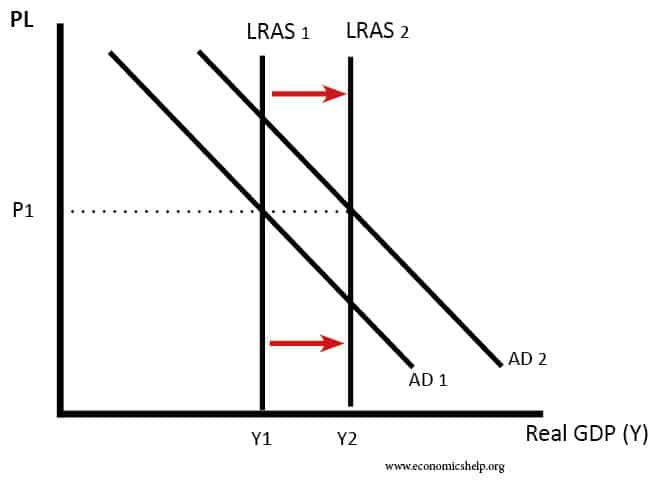
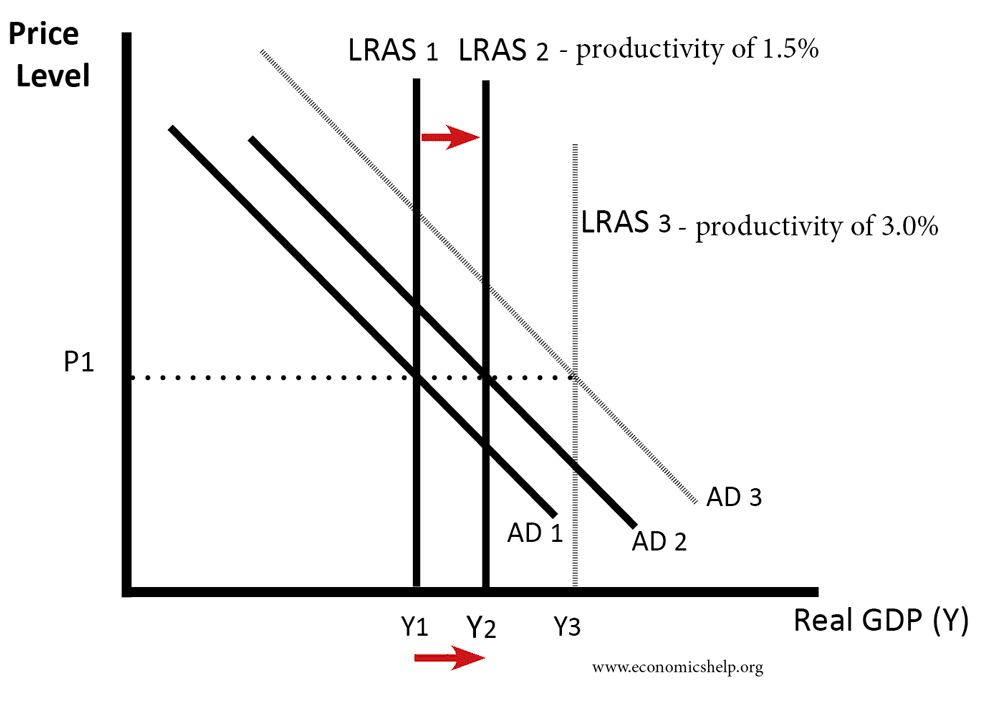
Diagram of LRAS shift to the right
In this diagram the AS curve shifts to the right, increasing real output and decreasing the price level. This could occur due to increased productivity, better technology or improved supply-side policies in the economy.
Increase in LRAS shifts real GDP from Y1 to Y2
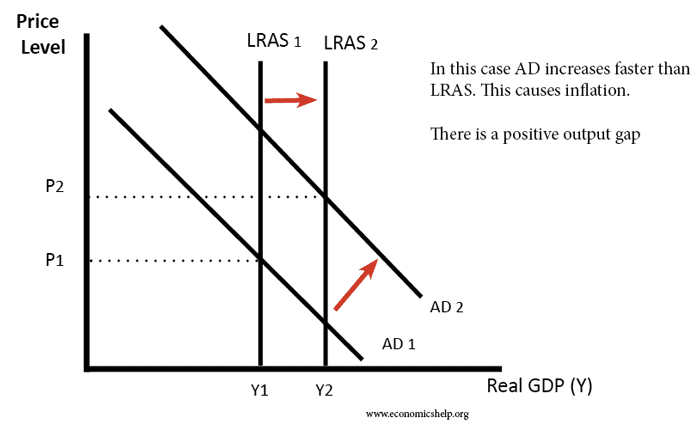
AD increases faster than LRAS – causing inflation.
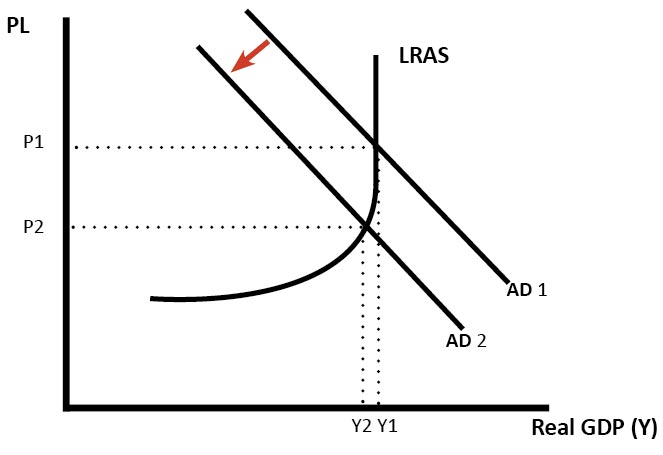
Fall in AD
Fall in AD – depends on spare capacity
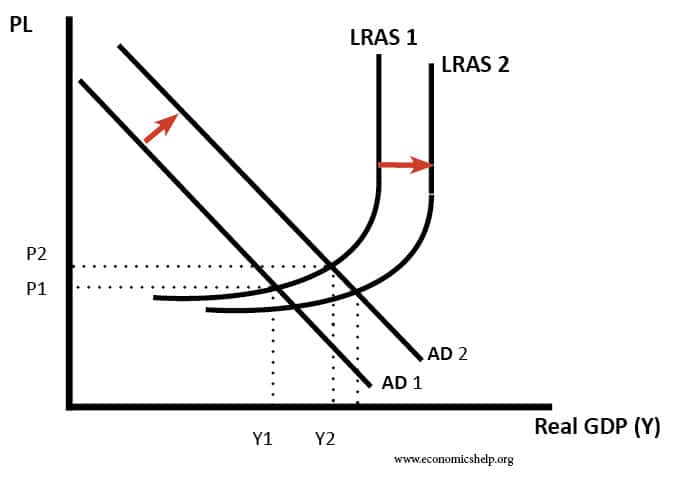
Shift in Keynesian LRAS
Keynesian economists believe LRAS is not perfectly inelastic. This diagram shows an increase in both LRAS and AD, causing economic growth without increase in price level.
Diagram showing the effect of an increase in AD depends on slope of AS Curve
At close to full capacity, an increase in AD causes inflation.
The impact of an increase in AD depends on the situation of the economy.
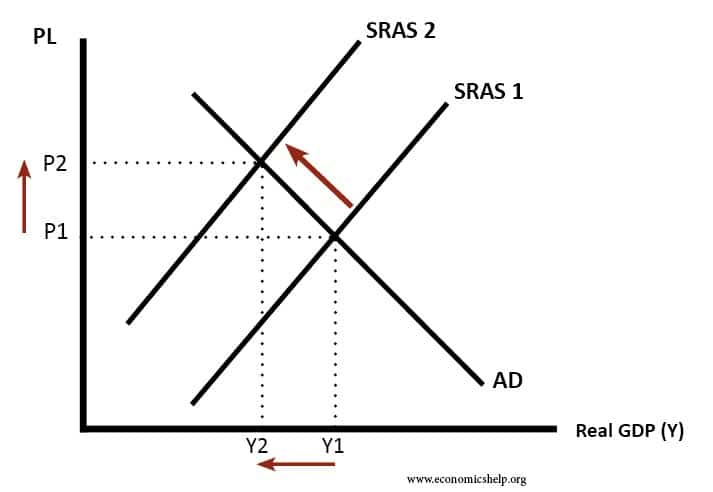
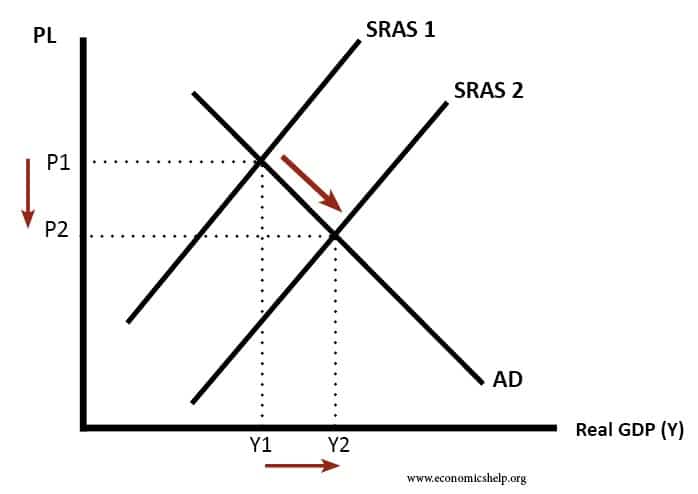
Shift in SRAS to Left
This could occur due to an increase in the price of oil or other raw material.
SRAS shifts to the left, leading to higher price level and fall in real GDP.
Shift of SRAS to the right
A fall in the price of oil will shift the SRAS to the right.
Slower economic growth due to weak demand
Slower economic growth due to low productivity growth
When to use LRAS, SRAS, AS
I would use SRAS for showing the effect of a change in costs (e.g. oil prices, wages).
I would use LRAS for showing the impact of an increase in capital, an increase in productive capacity (long-term economic growth).
Sometimes, I just use AS as that gets the basic idea across. The distinction between SRAS and LRAS is a little artificial. I would say the SRAS is quite similar to the Keynesian LRAS
It doesn’t matter in the sense that both are acceptable economics.
I prefer the Keynesian view of LRAS (sloping upwards) because I feel it is closer to reality. Also, it is good for using for evaluation. However, some exam boards state a preference for the classical view of LRAS – inelastic.
isn’t the LRAS a vertical line as the output number doesn’t change with the price.
thats what i thought
The classical view of the LRAS is certainly inelastic. This shows a Keynesian view of LRAS which is inelastic at full capacity but also has areas of spare capacity.


isn’t the LRAS a vertical line as the output number doesn’t change with the price.
thats what i thought
The classical view of the LRAS is certainly inelastic. This shows a Keynesian view of LRAS which is inelastic at full capacity but also has areas of spare capacity.
What are the assumptions underlying the AD/AS model? I saw this in my spec and I have no idea! 😮
There are three types of Aggregate Supply curve. They are three because the possible environments of a country in a macroeconomic view are just three.