Recently I wrote about impact of rising bond yields on long term bonds. There is uncertainty whether the rise in bond yields reflects economic growth or worries over government debt.
This post explains the inverse relationship between bond yields and bond prices
Bond Yield Curve Definition: The bond yield curve reflects the yield on government bonds depending on the maturity of the bond.
Typical Bond Yield Curve

A typical bond yield curve looks like this with higher yields on longer term bonds.
Long term bonds – 20 or 30 years usually require a higher interest rate than short term bonds. This is because in normal circumstances people expect inflation. Inflation means the value of money will decline over time and so investors will demand a higher interest rate on long term bonds to compensate for the falling real value of a bond.
Spread on Bond Yields
- The spread is the difference between the yield on a long term bond and a short term bond.
- For example, if a 30-year bond pays 5.00% while a 1-year bond pays 3.55%, the spread is 1.45%.
Increasing Spread
If the gap between long term bonds and short term bonds rises. This is a sign that markets expect a rise in inflation. Thus at the first sign of economic recovery there will tend to be an increased gap between long term and short term bonds. Investors expect future inflation so require a higher yield on long term bonds to compensate.
Inverse Yield Curve

However, sometimes yield curves can give different picture. In this yield curve. Long term bond yields are lower than short term bond yields. This usually occurs when markets expect deflation.
If markets expect deflation, like in the nineteenth century, then yield curves will be negative. This is because deflation increases the value of money, therefore, the real value of bonds will increase over time. This makes long term bonds more valuable than short term bonds. Therefore, investors accepts a lower yield on long term bonds.
Inverted Yield Curve as a forecast for recession

The interest rate spread is the rate on long-term bonds (10 year treasuries) – short-term assets 3 month treasuries)
An inverted yield curve is often an accurate prediction of economic slowdown. An inverted yield curve has correctly predicted a worsening economic situation 5 times out of 6 since 1970. (But, also shows investors can sometimes get predictions wrong)

Of course, there can be other factors affecting bond yield curves such as confidence, speculation and worries over government debt default.
Bond Yields
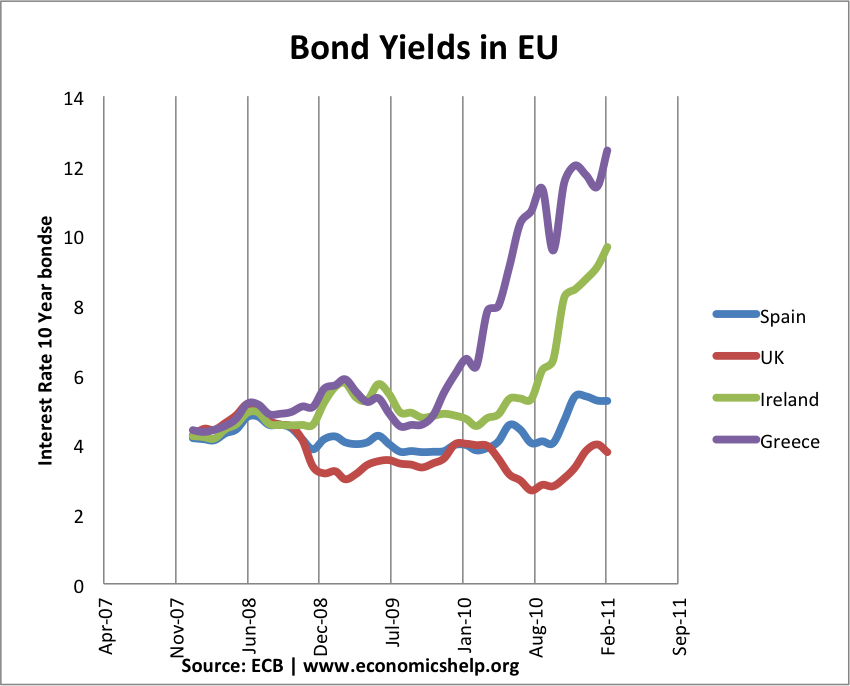
These are the different bond yields on 10-year government bonds within the EU. Countries like Italy and Ireland have higher bond yields (2011) because of fears over a potential default.
Further reading
The Yield Curve is inverted: According to my definition a yield curve is inverted if the spread between long-term yield and short term yields is below the Market reward for interest rate risk:
Model of the Yield Curve.
Computation of the Normal Yield Curve.
The steepness of the yield curve is negatively correlated with short-term interest rates and positively correlated with the volatility of interest rates.
It will normal when the rate of the 30 years Treasury Bonds will be 4.61%. From there the yields will resume their downward trend.
The long-term trend is still downward. The Crash will take place for the yield on 30 Years US Treasury Bonds = 3.623%.
Read: Prepare for the Crash, The Age of Turbulence.
Plea for a New World Economic Order.