
The Fear and Greed Index measures investor sentiment in financial markets. It tries to show whether markets are being driven more by fear (prices fall) or greed (prices rise).
 Snapshot 24 November 2025. CNN
 Fear and greed index
The scale runs from 0 to 100:
- 0–24 = Extreme Fear
- 25–44 = Fear
- 45–55 = Neutral
- 56–75 = Greed
- 76–100 = Extreme Greed
Fear and Greed Index is based on seven indexes
- Stock price momentum (S&P 500 vs 125-day average)
- Stock price strength (number of stocks hitting highs vs lows)
- Stock price breadth (market volume moving into/out of stocks)
- Put/Call options (fear shows as more hedging)
- Junk bond demand
- Market volatility (VIX)
- Safe-haven demand (stocks vs bonds)
1. Stock Price Momentum (S&P 500 vs. 125-day moving average)
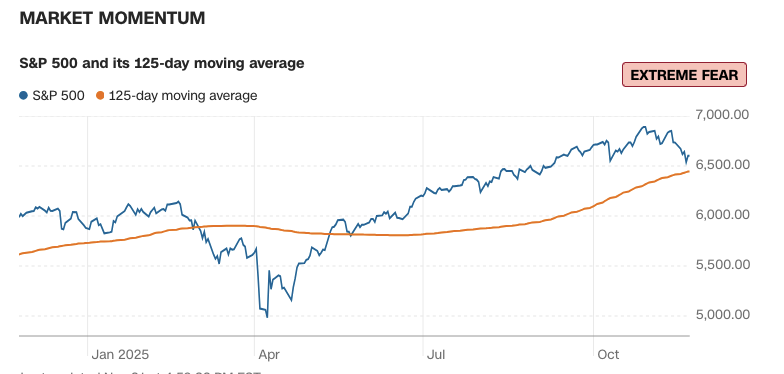
This measures whether the S&P 500 is trading above or below its long-term trend.
- If the S&P is far above the 125-day moving average, it signals strong momentum → Greed.
- If the S&P is far below, momentum is negative → Fear.
Markets in a strong uptrend indicate optimism and risk-taking. Weak momentum suggests anxiety, uncertainty, or recession fears.
2. Stock Price Strength (number of new 52-week highs vs lows)
This counts how many individual stocks are hitting new highs versus new lows on the NYSE.
- More stocks making new highs → broad market confidence → Greed.
- Many stocks making new lows → widespread selling → Fear.
This shows the underlying health of the market. When many stocks fall to lows, it means negative sentiment is spreading.
3. Stock Price Breadth (volume in advancing vs declining stocks)
This looks at how trading volume is distributed. It measures whether money is flowing into most stocks or out of them.
- High volume in “advancing” stocks = bullish participation → Greed.
- High volume in “declining” stocks = broad selling pressure → Fear.
Even if the index is rising, weak breadth (e.g. just a few AI stocks) can indicate a fragile rally. Strong breadth (a large share of stocks) shows conviction.
4. Put/Call Ratio (options hedging behavior)
The index uses the CBOE Put/Call Ratio.
- More puts than calls → investors are hedging or betting against the market → Fear.
- More calls than puts → investors are speculating on gains → Greed.
5. Junk Bond Demand (credit market risk appetite)
This measures the yield spread between junk bonds and safe Treasury bonds.
- Narrow spread (investors accept low extra reward for risky bonds) → Greed.
- Wide spread (investors demand high yield to compensate risk) → Fear.
Credit markets often detect stress before stock markets. A flight from junk bonds shows deep risk aversion.
6. Market Volatility (VIX Index)
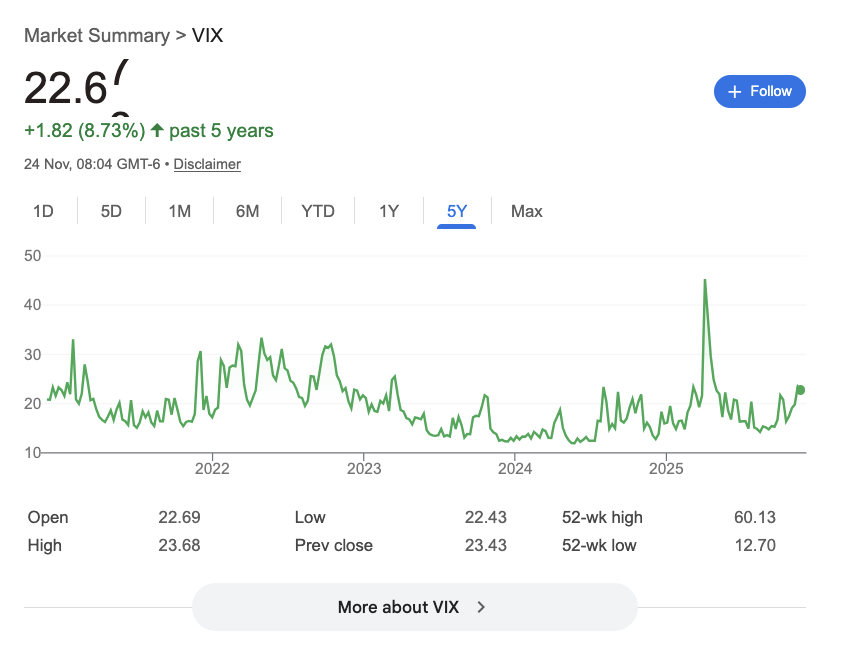
The VIX measures implied volatility in S&P 500 options.
- Low VIX → calm, complacency, confidence → Greed.
- High VIX → stress, panic, expectation of sharp drops → Fear.
Volatility spikes when markets expect bad news.
7. Safe-Haven Demand (stocks vs bonds)
This compares the performance of the S&P 500 with Treasury bonds over 20 trading days.
- When stocks outperform bonds, investors prefer risky assets → Greed.
- When bonds outperform stocks, investors seek safety → Fear.
Bond markets often reflect recession worries and risk aversion faster than equities.
What Other Factors could be of use?
- Headlines
- Price to earning ratios
- Gold – strong demand for gold suggests flight to safety
- Macro-data is economy slowing down
- Geopolitical events. Shocks tend to cause fear.
Related
About The Author
