
Economics Help AQA GCSE Economics – 4.5 Economic growth • 4.6 Unemployment • 4.7 Inflation

Growth, Unemployment & Inflation

Interactive multiple-choice revision (AQA GCSE-style). Check your score after each section.

4.5 Economic growth

Definition, measurement, causes, consequences (including recession) and policies.

Q1. Economic growth is best defined as:
Real GDP adjusts for inflation, so it measures changes in actual output.
Q2. Which measure is most commonly used to measure economic growth?
Nominal GDP can rise just because prices rise; real GDP removes inflation.
Q3. Economic growth caused by higher consumer spending is best described as growth from:
Higher demand (C, I, G or X−M) can raise output in the short run if spare capacity exists.
Q4. Which factor improves the quality of resources and can raise long-run growth?
Improving skills raises labour productivity (output per worker/hour).
Q5. Which is a possible disadvantage of rapid economic growth?
Growth can create pollution/congestion and use up non-renewable resources.
Q6. A recession is best defined as:
Recession is negative growth: output falls (often with rising unemployment).
Q7. Which could cause a recession by reducing total demand?
Falling consumption/investment reduces AD, lowering output and jobs.
Q8. Which is most likely to be a consequence of recession for the government?
Recession reduces incomes/profits (lower taxes) and raises benefit spending.
Q9. Which policy is most likely to promote long-run economic growth?
Supply-side improvements raise productive capacity and productivity.
Q10. A drawback of using only demand-side policies to promote growth is that:
If capacity is limited, extra demand can push up prices rather than output.

4.6 Employment and unemployment

Definitions, measurement, causes/types, consequences and policies.

Q1. A person is counted as unemployed if they are:
Measured via labour force surveys: unemployed must be available and seeking work.
Q2. Full employment means:
Some unemployment exists due to people changing jobs (frictional).
Q3. The unemployment rate is calculated as:
Labour force = employed + unemployed.
Q4. If a country has 2 million unemployed and a labour force of 40 million, what is the unemployment rate?
2 ÷ 40 = 0.05 → 5%.
Q5. Frictional unemployment is caused by:
Even in a healthy economy, some people are between jobs.
Q6. Structural unemployment is most likely when:
Often caused by technological change, global competition, or declining industries.
Q7. Cyclical unemployment is most likely to rise during:
Cyclical unemployment tracks the business cycle.
Q8. Which is a consequence of unemployment for the economy as a whole?
Unused labour means the economy produces below its potential.
Q9. Which policy is most likely to reduce structural unemployment?
Improving skills helps workers match new jobs.
Q10. Which policy is most likely to reduce cyclical unemployment?
If unemployment is due to weak demand, demand-side stimulus can raise output and jobs.

4.7 Inflation

Definitions, measurement (CPI), causes, consequences and policies.
Q1. Inflation is best defined as:
Inflation is about the overall price level, not the price of one product.
Q2. Deflation is:
Deflation is negative inflation (prices falling overall).
Q3. Inflation is most commonly measured using:
CPI tracks the cost of a “basket” of goods and services over time.
Q4. Demand-pull inflation is caused by:
Too much demand relative to supply can push prices up.
Q5. Cost-push inflation is most likely caused by:
Rising input costs (wages, energy, imported materials) can push prices up.
Q6. Who is most likely to lose out from unexpected inflation?
Inflation reduces the real value (purchasing power) of money repayments and savings.
Q7. A likely consequence of inflation for workers is:
If pay rises are below inflation, purchasing power falls.
Q8. Which policy is most likely to reduce demand-pull inflation?
Higher interest rates reduce borrowing/spending, lowering demand pressures.
Q9. Which policy is most likely to help reduce cost-push inflation in the long run?
Higher productivity can reduce costs per unit, easing inflation pressure over time.
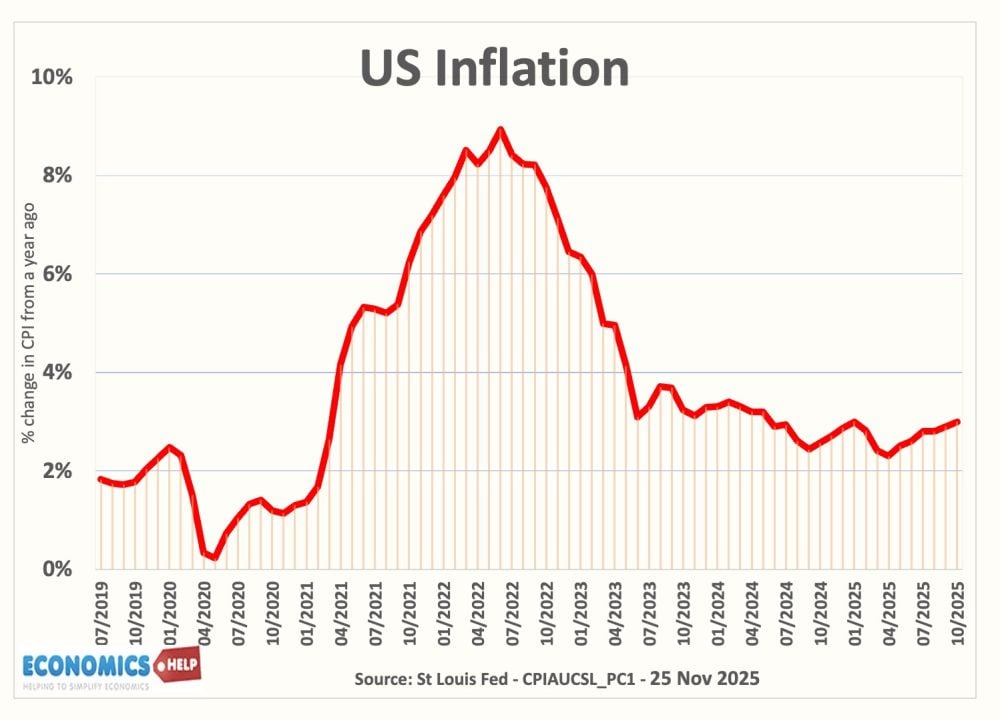
US inflation rate and price level (illustration of disinflation: inflation falling but prices still rising)

Diagram: Inflation rate falls after mid-2022, but the price level keeps rising.

Q10. What happened to the US price level between 07/2022 and 07/2023?
Explanation: Although the inflation rate was falling, it was still positive for most of the period. That means the price level kept rising, but prices were increasing at a slower rate (disinflation).