Definition of Dependency Ratio: The dependency ratio measures the % of dependent people (not of working age) / number of people of working age (economically active)

Dependency Ratio =
Number of Children (0-15) + Number of Pensioners ( > 65 )
——————————————————————–
Number of Working age 16-65
- A dependency ratio of 1.2 means that for every 10 workers there are 12 people not of working age.
The Real Dependency Ratio
The real (or effective) dependency ratio looks at the ratio of economically active workers compared to inactive.The effective dependency ratio doesn’t just look at the age profile but, whether people are economically active or not.
For example, many people aged 16-65 are effectively economically inactive, including:
- Students
- People on sickness and disability allowance
- Long-term unemployed (given up looking for work)
- Early retirement
- Mothers (or fathers) looking after children at home
Note: The unemployed are still counted as economically active – if they are actively seeking work. However, if they have given up looking for work, then they are counted as inactive.
- Similarly, some people over 65 may still be working.
The definition of economically active is not always clear-cut (e.g. a part-time worker over 65 is something of a grey area.)
Impact of Female Participation on Effective Dependency Ratios
Many in Europe are concerned about an increase in the dependency ratio. e.g. The dependency ratio in the UK is forecast to rise from 0.34 to 0.65 by 2040. However, it is worth bearing in mind that this rise in dependency ratio is partly offset by:
- Rising female participation in the labour market
- Smaller % of people under 18.
- Proposed rise in the pension age.
Importance of the Dependency Ratio
The dependency ratio is important because it shows the ratio of economically inactive compared to economically active. Economically active will pay much more income tax, corporation tax, and, to a lesser extent, more sales and VAT taxes.
The economically inactive under 16 and over 65 also tend to be bigger recipients of government spending e.g. education, pensions and healthcare.
An increase in the dependency ratio can cause fiscal problems for the government. For example, Italy already has a national debt of over 100%, a doubling of the dependency ratio is going to cause difficult choices for government to make.
Dependency Ratio in the US
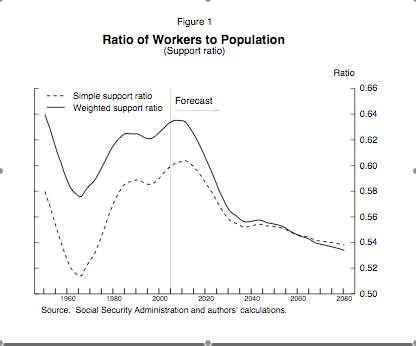
Graph showing forecast inverse dependency ratio in the US
Note: This shows the ratio of workers to the population. Usually, population dependency ratios show the number of dependents to the population. As the number of workers to population declines, the classic dependency ratio rises.
This US method is basically inverting the picture. WIth more old people, the ratio of workers to population falls.
The weighted dependency support ratio
This takes into account that people over 65, tend to require higher government spending than children under 16. (e.g. old people require more health care spending). Therefore, the weighted support ratio gives a higher weighting to dependents over 65.
According to research by The Federal Reserve [link]The dependency ratio in 2005 was 0.63. This is forecast to fall to 0.53 by 2080.
UK Dependency Ratio
- In the UK, the dependency ratio is expected to rise from 0.35 (2000) to 0.65 (2004) [Source FT 5/12/03]
European Dependency Ratio
In other European countries, the dependency ratios are expected to rise at a faster rate. Not only are there an increasing number of people over 65, but, also a decline in the number of people of working age.
In Italy for example, the number of workers aged 15-59 is expected to fall from 35m to 21.6m. This will lead a higher dependency ratio. [Source FT 5/12/03]
Forecast for Dependency Ratios in Different Countries

Source: Dept for work and Pensions
Sources: For non-EU countries, Population Division of the Department of Economic and Social Affairs of the United Nations Secretariat, World Population Prospects: the 2004 revision; for EU counties, Ageing Society Indicators, EUROSTAT 2005.
Propspects for Dependency Ratios in Different countries

source: National Bank of Denmark
Solutions to higher dependency ratios
As dependency ratios rise, some solutions include:
- Raising retirement age in line with longer life spans
- Encouraging immigration of people in early 20s and 30s.
- Reducing the real value of state pension and encouraging people to take out private pensions.
- Raise income taxes to be able to afford pension and health care spending.
- Economic growth enables higher tax revenue from the same tax rates.
Related