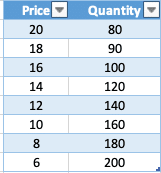
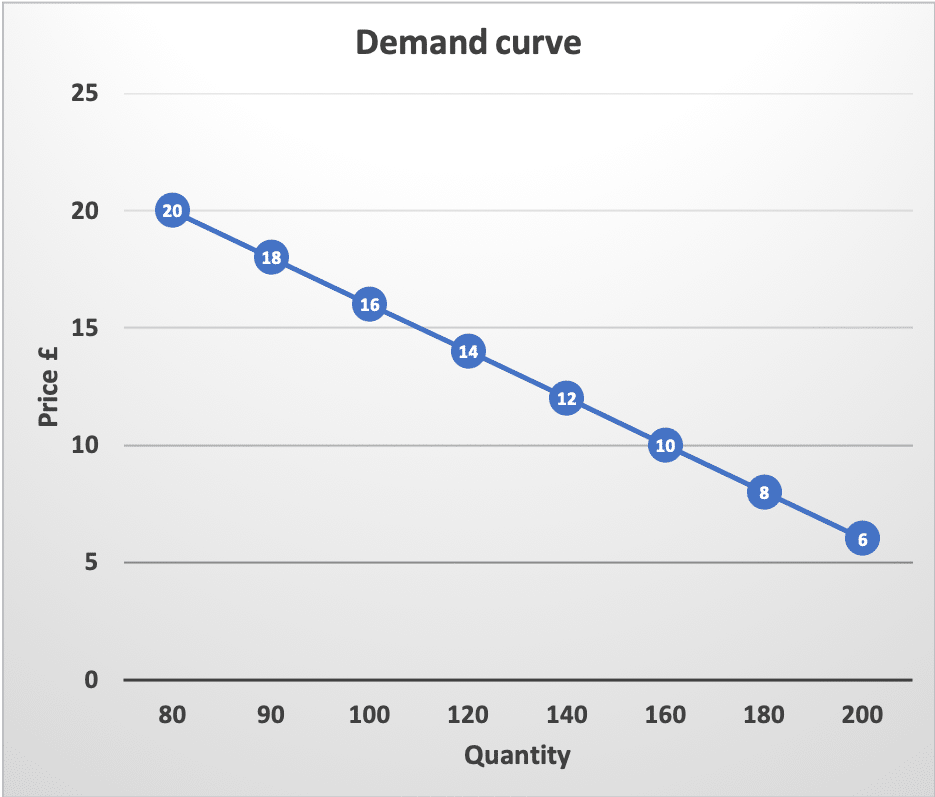
The demand curve shows the amount of goods consumers are willing to buy at each market price.
An individual demand curve shows the quantity of the good, a consumer would buy at different prices.
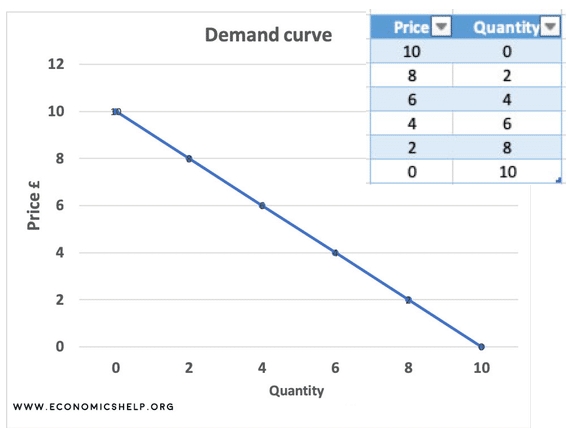
Plotting price and quantity supply
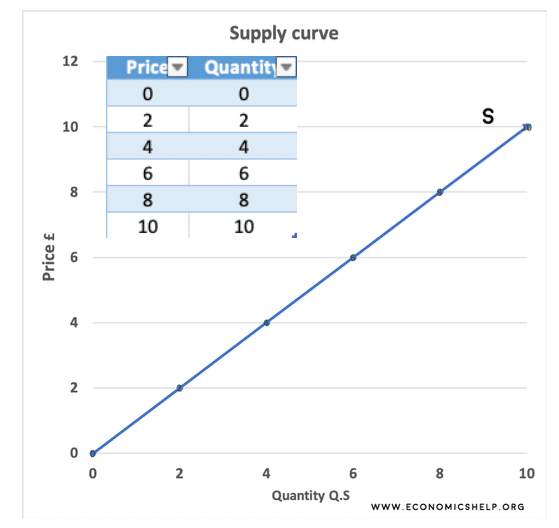
Market equilibrium

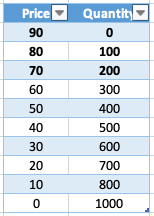
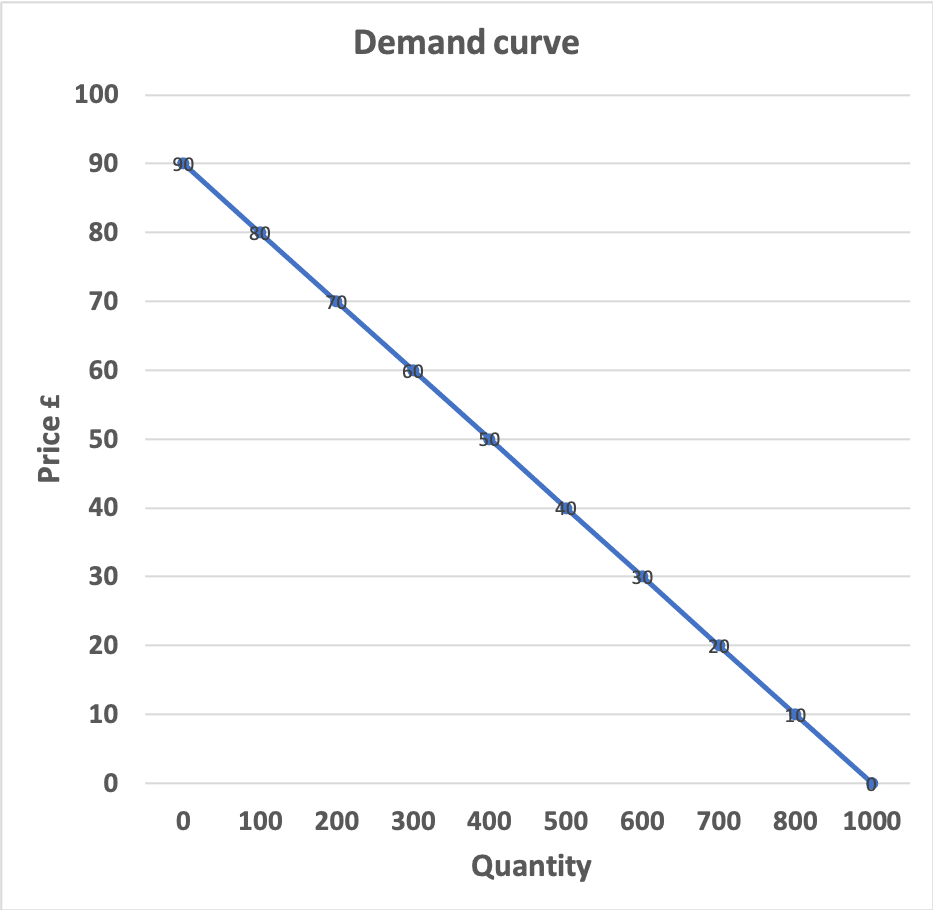
More demand curves

Related
