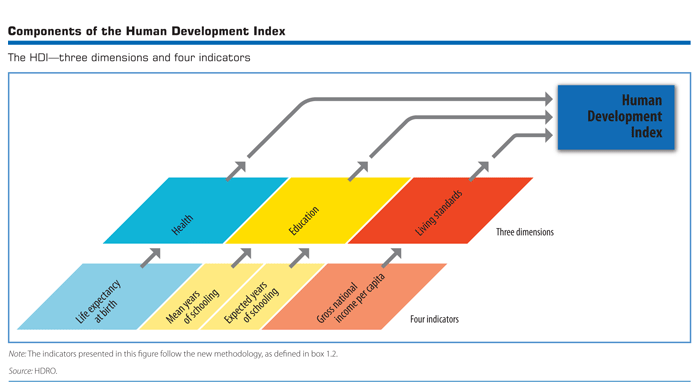
The Human Development Index (HDI) is a measure of economic development and economic welfare. The Human Development Index examines three important criteria of economic development (life expectancy, education and income levels) and uses this to create an overall score between 0 and 1.
- 1 indicates a high level of economic development,
- 0 a very low level.
The HDI combines:
- Life Expectancy Index. Average life expectancy compared to a global expected life expectancy.
- Education Index
- mean years of schooling
- expected years of schooling
- Income Index (GNI at PPP)
Components of the Human Development Index
What the HDI shows
- The HDI gives an overall index of economic development. It has some limitations and excludes several factors that might have been included, but it does give a rough ability to make comparisons on issues of economic welfare – much more than just using GDP statistics show.
Limitations of Human Development Index
- Wide divergence within countries. For example, countries like China and Kenya have widely different HDI scores depending on the region in question. (e.g. north China poorer than south-east)
- HDI reflects long-term changes (e.g. life expectancy) and may not respond to recent short-term changes.
- Higher national wealth does not indicate welfare. GNI may not necessarily increase economic welfare; it depends on how it is spent. For example, if a country spends more on military spending – this is reflected in higher GNI, but welfare could actually be lower.
- Also, higher GNI per capita may hide widespread inequality within a country. Some countries with higher real GNI per capita have high levels of inequality (e.g. Russia, Saudi Arabia)
- However, HDI can highlight countries with similar GNI per capita but different levels of economic development.
- Economic welfare depends on several other factors, such as – threat of war, levels of pollution, access to clean drinking water e.t.c.
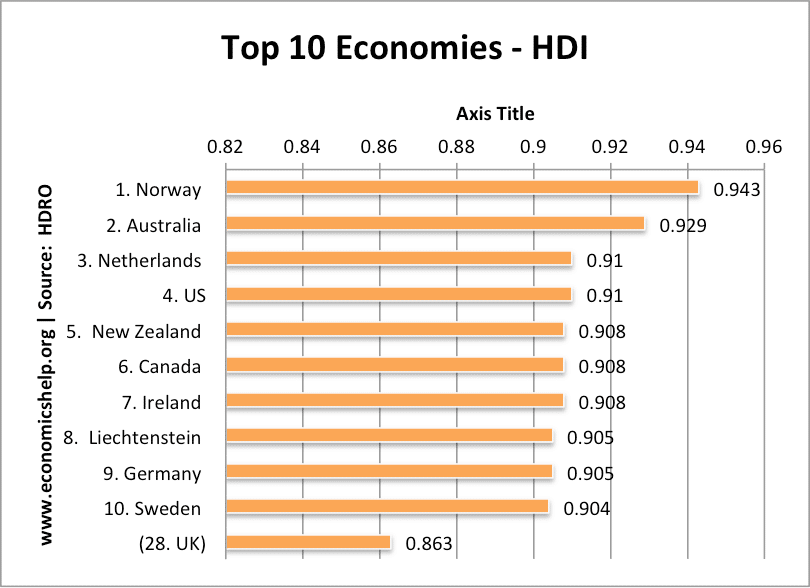
Top 10 Human Development Index
Components of HDI score 2011
| (HDI) | Life expectancy at birth | Mean years of schooling | Expected years of schooling | (GNI) per capita | |||||||
| HDI rank | Value | (years) | (years) | (years) | (Constant 2005 PPP$) | ||||||
| 2011 | 2011 | 2011a | 2011a | 2011 | |||||||
| 1 | Norway | 0.943 | 81.1 | 12.6 | 17.3 | 47,557 | |||||
| 2 | Australia | 0.929 | 81.9 | 12.0 | 18.0 | 34,431 | |||||
| 3 | Netherlands | 0.910 | 80.7 | 11.6 | b | 16.8 | 36,402 | ||||
| 4 | United States | 0.910 | 78.5 | 12.4 | 16.0 | 43,017 | |||||
| 5 | New Zealand | 0.908 | 80.7 | 12.5 | 18.0 | 23,737 | |||||
| 6 | Canada | 0.908 | 81.0 | 12.1 | b | 16.0 | 35,166 | ||||
| 7 | Ireland | 0.908 | 80.6 | 11.6 | 18.0 | 29,322 | |||||
| 8 | Liechtenstein | 0.905 | 79.6 | 10.3 | c | 14.7 | 83,717 | ||||
| 9 | Germany | 0.905 | 80.4 | 12.2 | b | 15.9 | 34,854 | ||||
| 10 | Sweden | 0.904 | 81.4 | 11.7 | b | 15.7 | 35,837 |
Lowest 10 Counties for HDI
| (HDI) | Life expectancy at birth | Mean years of schooling | Expected years of schooling | (GNI) per capita | ||||||||
| 177 | Eritrea | 0.349 | 61.6 | 3.4 | 4.8 | 536 | ||||||
| 178 | Guinea | 0.344 | 54.1 | 1.6 | w | 8.6 | 863 | |||||
| 179 | Central African Republic | 0.343 | 48.4 | 3.5 | 6.6 | 707 | ||||||
| 180 | Sierra Leone | 0.336 | 47.8 | 2.9 | 7.2 | 737 | ||||||
| 181 | Burkina Faso | 0.331 | 55.4 | 1.3 | r | 6.3 | 1,141 | |||||
| 182 | Liberia | 0.329 | 56.8 | 3.9 | 11.0 | 265 | ||||||
| 183 | Chad | 0.328 | 49.6 | 1.5 | i | 7.2 | 1,105 | |||||
| 184 | Mozambique | 0.322 | 50.2 | 1.2 | 9.2 | 898 | ||||||
| 185 | Burundi | 0.316 | 50.4 | 2.7 | 10.5 | 368 | ||||||
| 186 | Niger | 0.295 | 54.7 | 1.4 | 4.9 | 641 | ||||||
| 187 | Congo (Democratic Republic of the) | 0.286 | 48.4 | 3.5 | 8.2 | 280 |
Notes:
Before 2011, the human development index used adult literacy rates rather than mean years of schooling.
The human development index was created by Mahbub ul Haq, and Amartya Sen.
- HDI at United Nations
Related