The aggregate supply curve shows the total supply in an economy at different price levels.
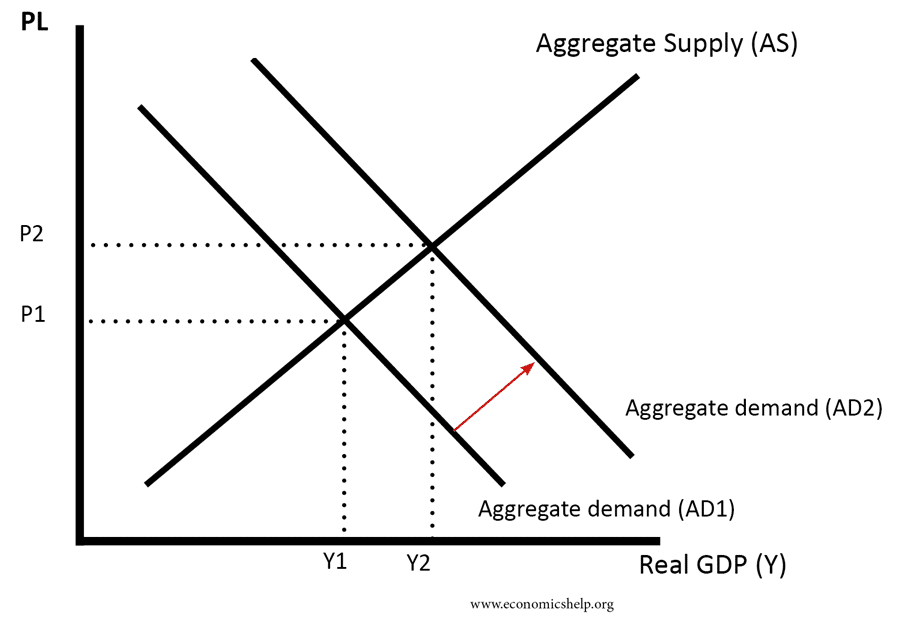
Generally, the aggregate supply curve slopes upwards – a higher price level encourages firms to supply more. However, there are different possible slopes for the aggregate supply curve. It could be highly inelastic (vertical) to very elastic. It is important to differentiate between
- Short-run aggregate supply curve (SRAS)
- Long-run aggregate supply curve (LRAS)
Which curve to draw?
There is not necessarily a ‘correct answer’ These are the most common aggregate supply curves
Short-run aggregate supply curve (SRAS)
In the short run, capital is fixed, firms can employ more labour (e.g. overtime) to respond to short-run increases in demand.
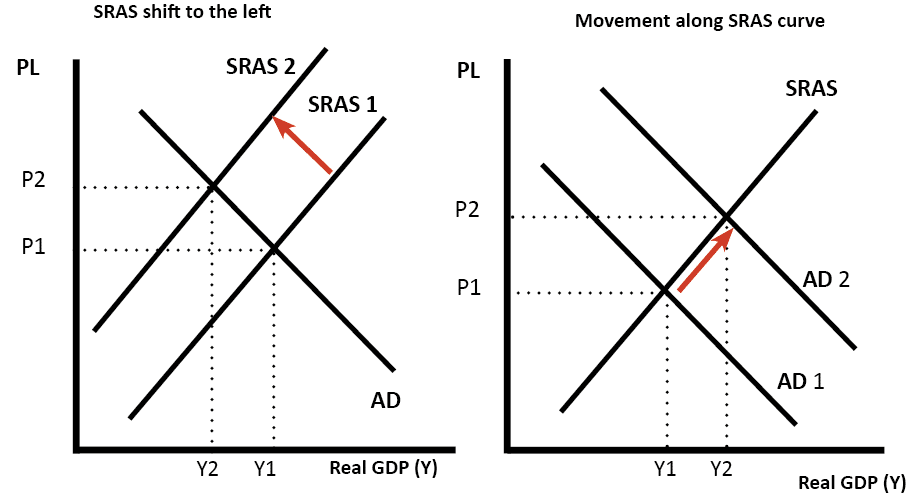
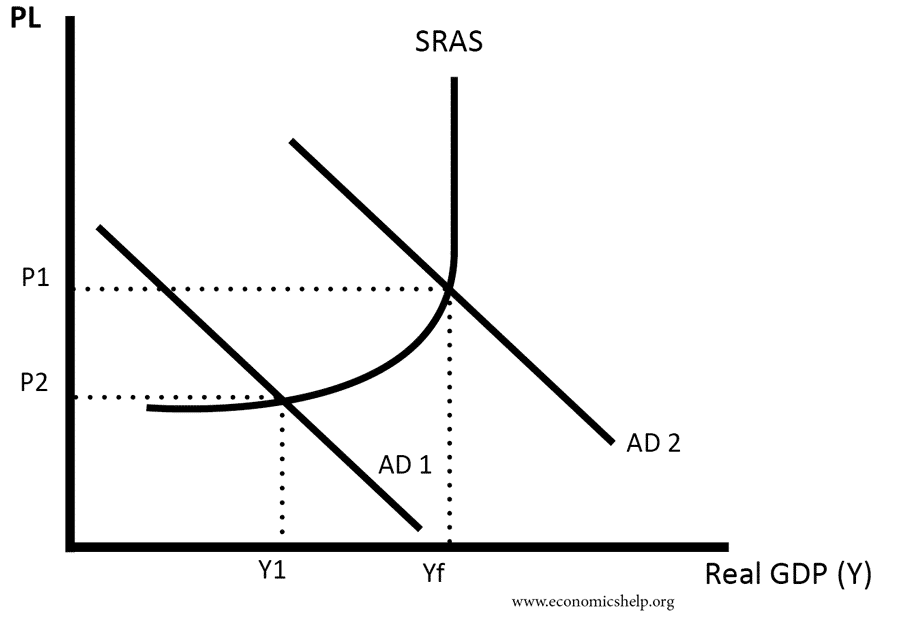
In the short run, we typically draw the curve as a straight line. However, in practice, the SRAS could become more inelastic as a firm gets closer to full capacity.
Long-run aggregate supply curve
There are two main types of the long-run aggregate supply curve
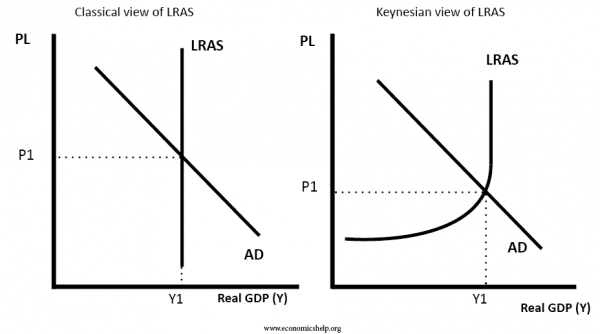
- Classical/Monetary – in long-term, AS is inelastic – Productive capacity is fixed by long-term factors such as investment. This assumes the economy reverts to full employment in long-term
- Keynesian – elastic AS curve in long-term – the economy can be below full capacity for a long time.
Long-term economic growth
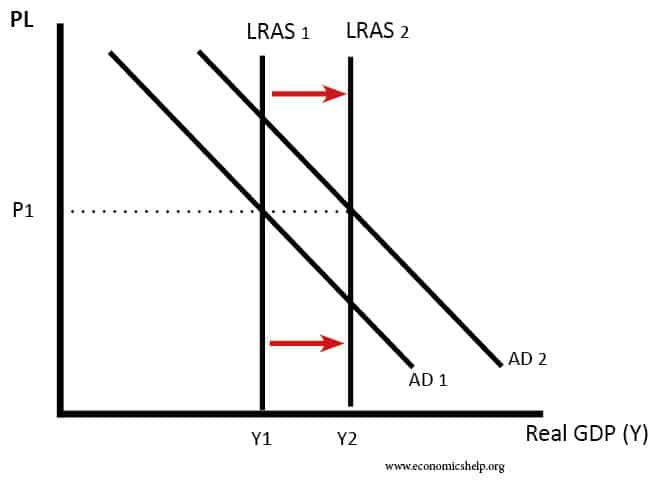
This shows long-term economic growth in the classic view – investment is shifting LRAS to the right causing economic growth without inflation
Keynesian view of short-run economic growth
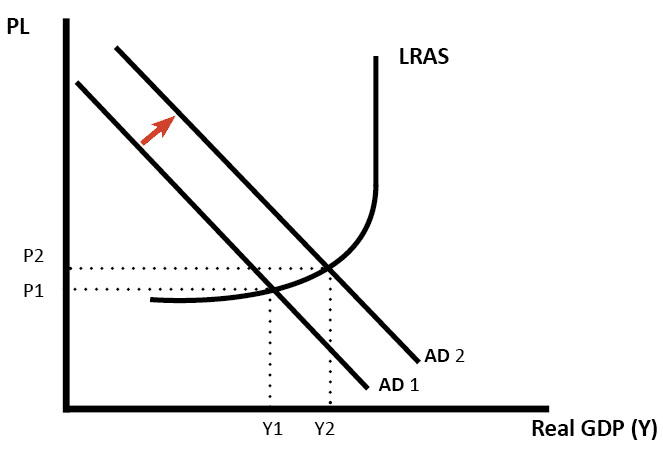
In this case, the economy is in recession at Y1, an increase in AD causes economic growth but only limited inflation because the economy is still on the elastic part of the LRAS curve.
Monetarist view of SRAS and LRAS
The monetarist view suggests that in the short-term, AS can be elastic, but in the long-term, AS is inelastic
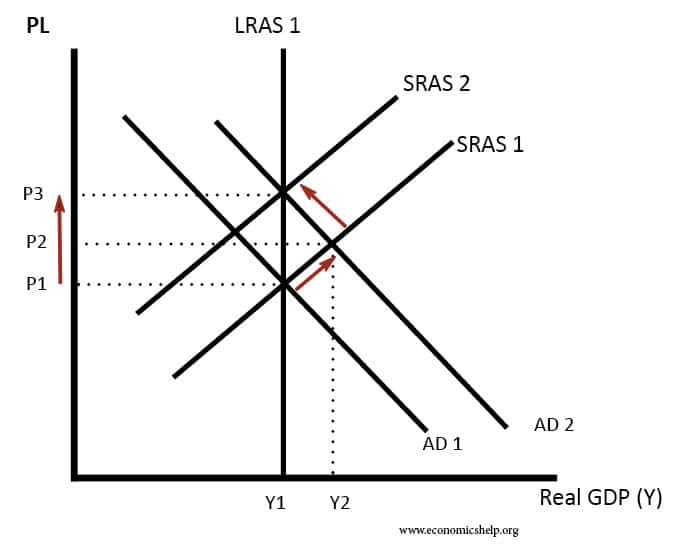
This shows a combination of SRAS and LRAS – initially, the increase in AD causes economic growth, but in the long-term only causes inflation.
Related
