Source: ONS
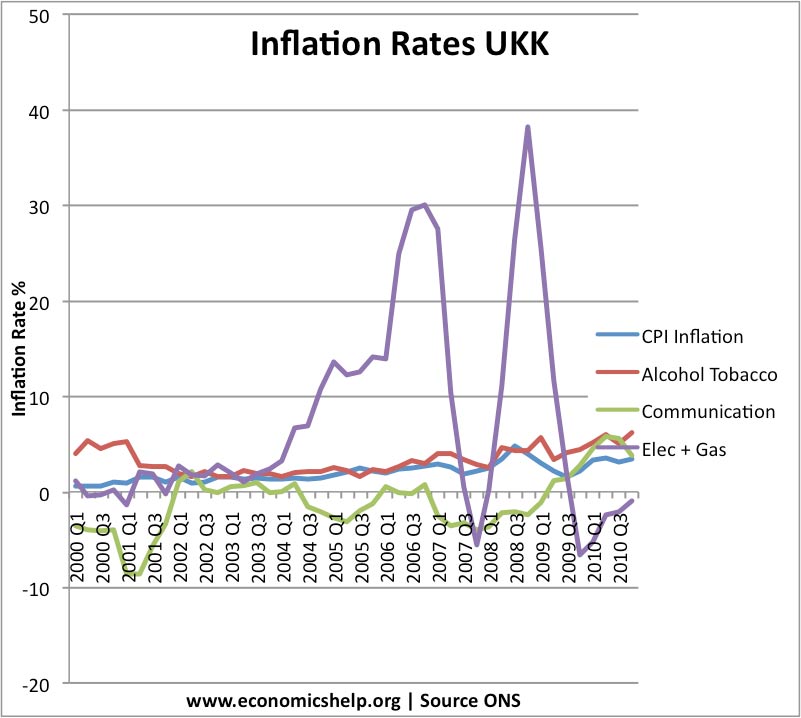
This graph shows how inflation rates for different categories can vary enormously.
Firstly, gas and electricity prices are by far the most volatile. This reflects the volatile nature of supply, it also reflects the fact demand and supply are inelastic. See: volatile food prices for the economic theory behind this volatility.
Despite the volatility, fuel prices have been rising faster than CPI inflation. This is a reflection of basic supply and demand factors. Demand is rising faster than supply. In particular economic growth in Asia is creating additional demand growth
Falling price of communications.
Communication prices have often experienced deflation. This is probably due to the improvements in technology and perhaps increased competition which puts downward pressure on prices.
Alcohol and tobacco have been quite close to CPI inflation, though slightly higher in recent years.
The CPI is calculate by using a weighted average. If you spend a higher % of income on fuels than other items, your personal inflation rate, is likely to be rising faster than CPI inflation.
For example:
Age UK says the over-55s are an average of £30 per month worse-off as a result of the rise in prices since September. And since January 2008 the average person aged 55 and over has experienced price increases at 5 per cent above headline inflation. The continuing impact of low mortgage interest rates has little benefit for those in later life but energy and food matter more. (Independent)
Related
- Gas and electricity prices
- Problems of calculating inflation
- Which inflation measure should we use?

