Readers Question: I have been learning about inflation for AS at the moment. I would like to know about whether inflation would be a short-term phenomenon as we were told inflation takes place when there is excess demand and price will rise, it will also encourage the company to produce more. Therefore, shouldn’t it be a short-term phenomenon as the company will eventually increase the output and adjust their supply to the market back at a lower price. However, in reality, inflation is more likely to take place over a long period of time with an increasing inflation rate.
Usually, inflation is demand-pull inflation. This is when Aggregate Demand increases faster than aggregate supply. This tends to be persistent.
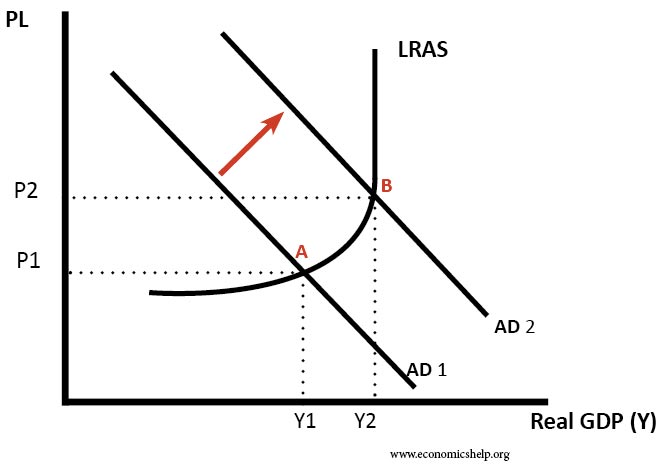
Demand-pull inflation occurs when the economy reaches full capacity. Firms can’t keep up with demand, so even though they would like to supply more they can’t. Therefore they respond by putting up prices.
In the UK productive capacity (Long run aggregate supply) tends to increase by 2.5% a year. If we have a strong rising demand of say 5% then we are likely to see demand-pull inflation. e.g. like in the Lawson boom of the 1980s
Demand Pull Inflation
Expectations
Another important factor in inflation is the role of expectations. If people expect high inflation, we tend to get high inflation. (e.g. if people expect inflation, firms will put up prices in anticipation, and workers will demand high wages) This is why when inflation is high, it is difficult to reduce it straight away. If inflation is 10% this year, people tend to expect inflation of 10% next year. Therefore high inflation often leads to more inflation. Unless the government deflate the economy. This makes inflation more long-lasting.
Cost-Push Inflation
Sometimes inflation can be a temporary phenomenon. A good example is the cost-push inflation of 2008. Oil prices rose to $150, this caused a spike in domestic UK inflation to over 5%. However, this increase in inflation was only temporary. When oil prices fell a few months later, the inflation rate dropped down
Diagram showing cost push inflation
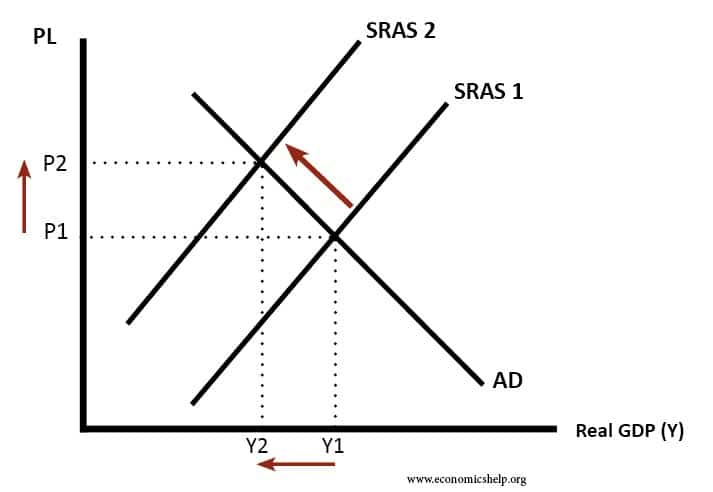
(though the diagram should really show SRAS rather than LRAS) For AS level just shifting AS to the left is the important thing.