Historical US Unemployment since 1900
- Sources
- 1890-1920 data are from Christina Romer (1986). “Spurious Volatility in Historical Unemployment Data”, The Journal of Political Economy, 94(1):
- 1920-1930 Robert M. Coen (1973). “Labor Force and Unemployment in the 1920’s and 1930”
- 1930- 1948 Bureau of Labor Statistics, Employment
- Thanks to User Peace
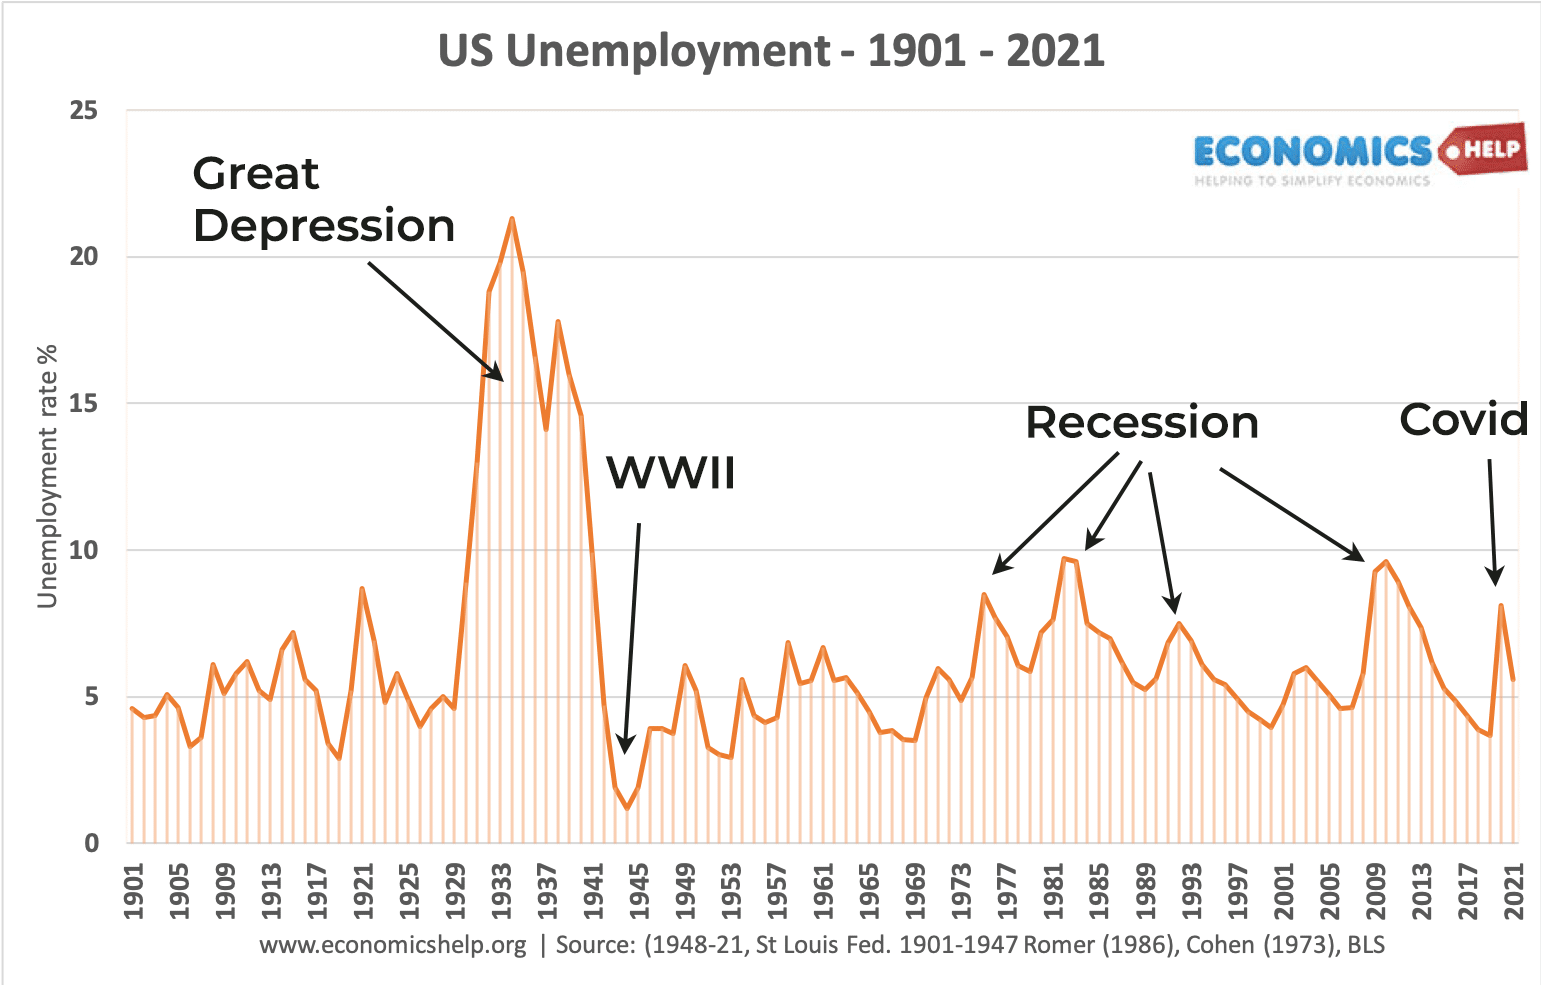
Generally, the US economy was expanding rapidly from 1901 to the First World War, with US firms increasing output with major gains in efficiency (e.g. economies of scale from assembly lines). Unemployment of over 5% was a reflection of some structural unemployment as old jobs in farming and inefficient manufacturing were lost. Despite strong growth in the first decade, by the start of the First World War, the US was in a mild recession and unemployment edged up. The start of the First World War (1914) saw a strong global economic recovery as the European powers increased spending on arms and related goods, which benefitted US economy. By the time the US entered the war in 1917, the US economy was growing strongly and unemployment falling. Due to mass mobilisation, by 1918, unemployment in the US had fallen to 3%.
Post-world War I
After the end of the First World War, the US entered a moderately severe recession – part of a global slowdown. Although the US started to recover by 1920, unemployment took time to fall as ex-servicemen reintegrated into the labour market.
In the 1920s, the US economy grew rapidly. It was a period known as the ‘roaring twenties’ – where apart from pockets of agriculture – the economy grew rapidly, boosted by strong consumer spending and confidence.
Great Depression
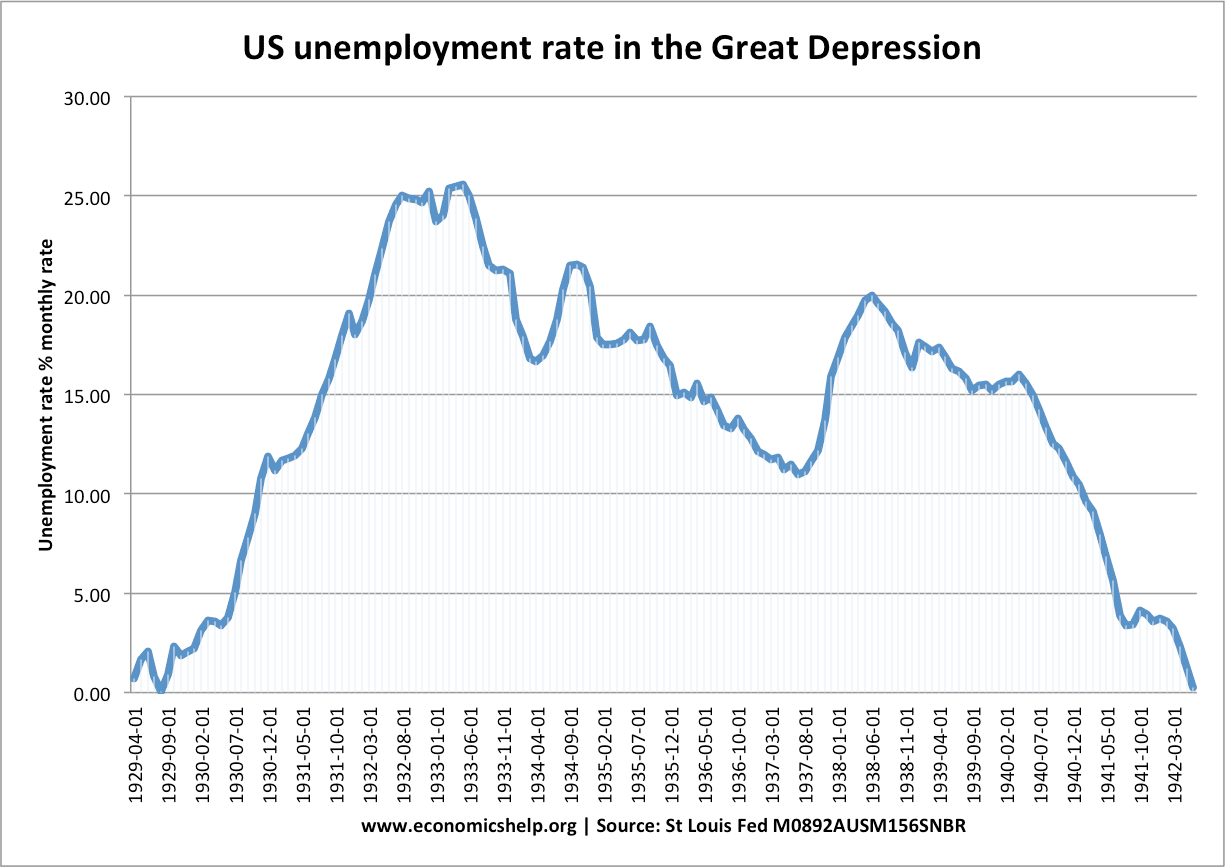
The standout feature of US unemployment in the Twentieth Century is the surge in unemployment during the Great Depression, where unemployment rose to over 20%. This was a reflection of the depth, scale and intensity of the Great Depression. GDP fell over 25%, over 500 banks closed down, the economy experienced severe deflation and many millions found themselves without work. It is worth bearing in mind, there was little if any support for the unemployed, and so the unemployment caused real hardship.
Not until the Second World War did the US return to full employment.
Postwar period 1945- 1970
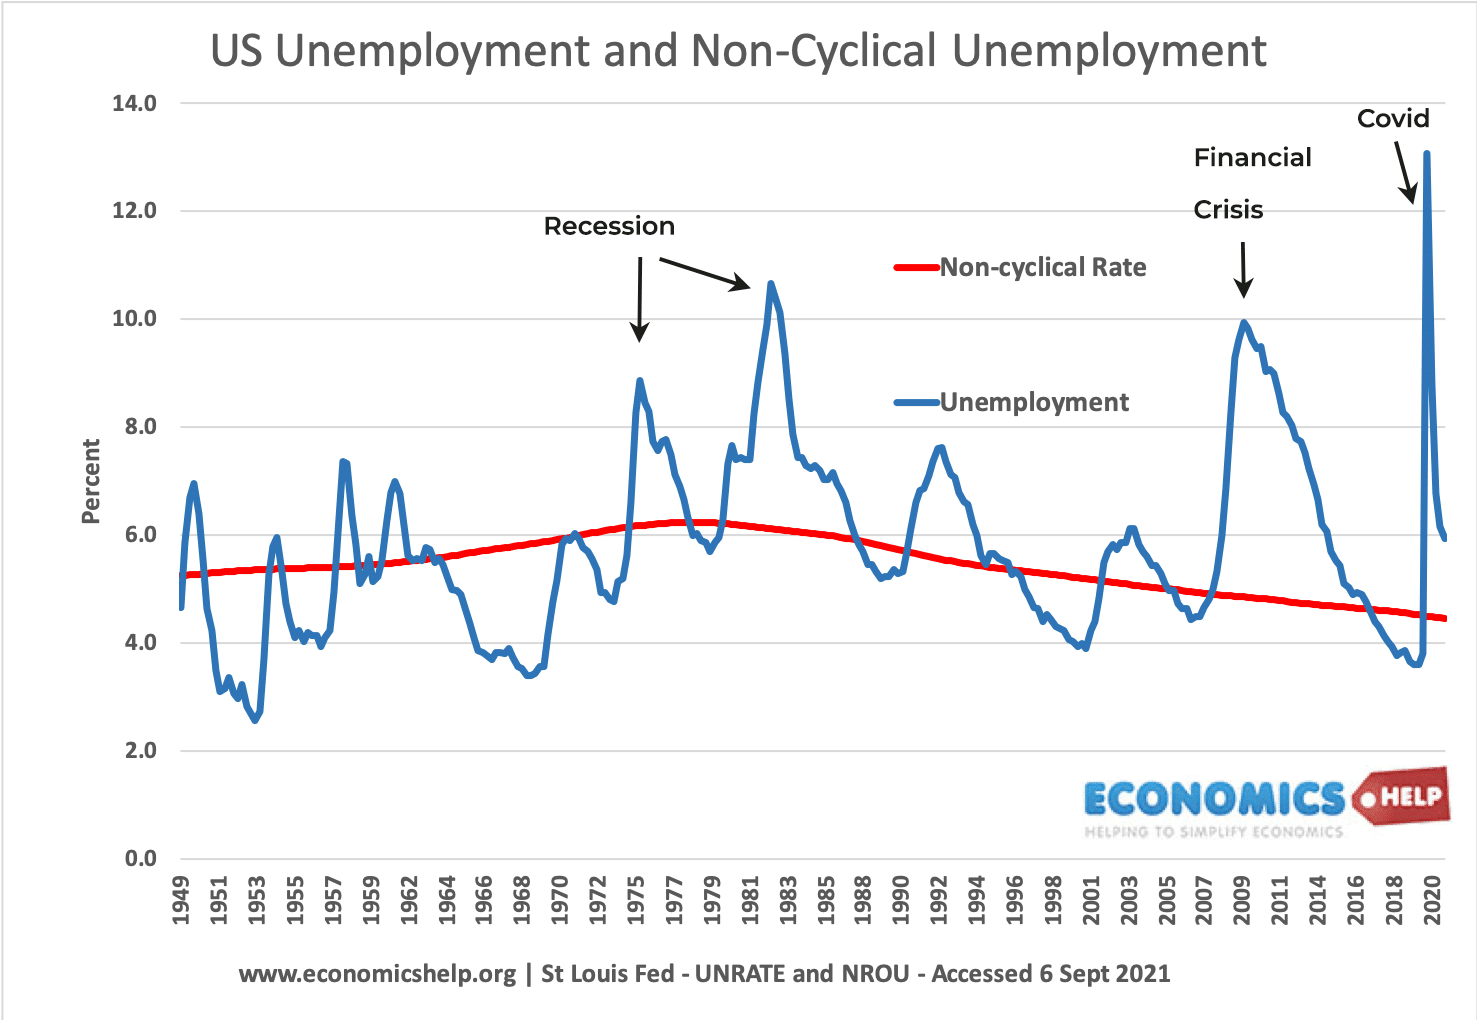
Unemployment of 3-4% is considered close to full employment. This is because there is always some frictional unemployment in the economy. In the post-war period, the US is largely close to full employment, with only a small rise in unemployment in the late 1950s/early 1960s.
1970s
In the 1970s, we start to see a rise in unemployment, this is both a rise in the natural rate and periods of cyclical unemployment. In the 1970s, the US economy was hit by higher oil prices and rising inflation, which led to a period of stagflation (high inflation and low growth)
1980s
In the early 1980s, the 1981/82 recession causes US unemployment to reach a record post-war level of just under 10%. However, 1983 there is then a fall in the underlying rate of unemployment due to more flexible labour markets.
2009 Financial crisis
In 2009, the abrupt financial crisis caused a rapid rise in unemployment as it hit both manufacturing and ‘white collar jobs in the finance sector. US unemployment then steadily fell until 2020 as the economic recovery was consistent and the labour market continued to be more flexible
There is a brief surge in 2020 as unemployment rose due to the Covid shutdown. The discrepancy in the graph is due to the monthly rise in unemployment was much higher to over 14%,. Annual figures take an average of the year.
What is the real unemployment rate?
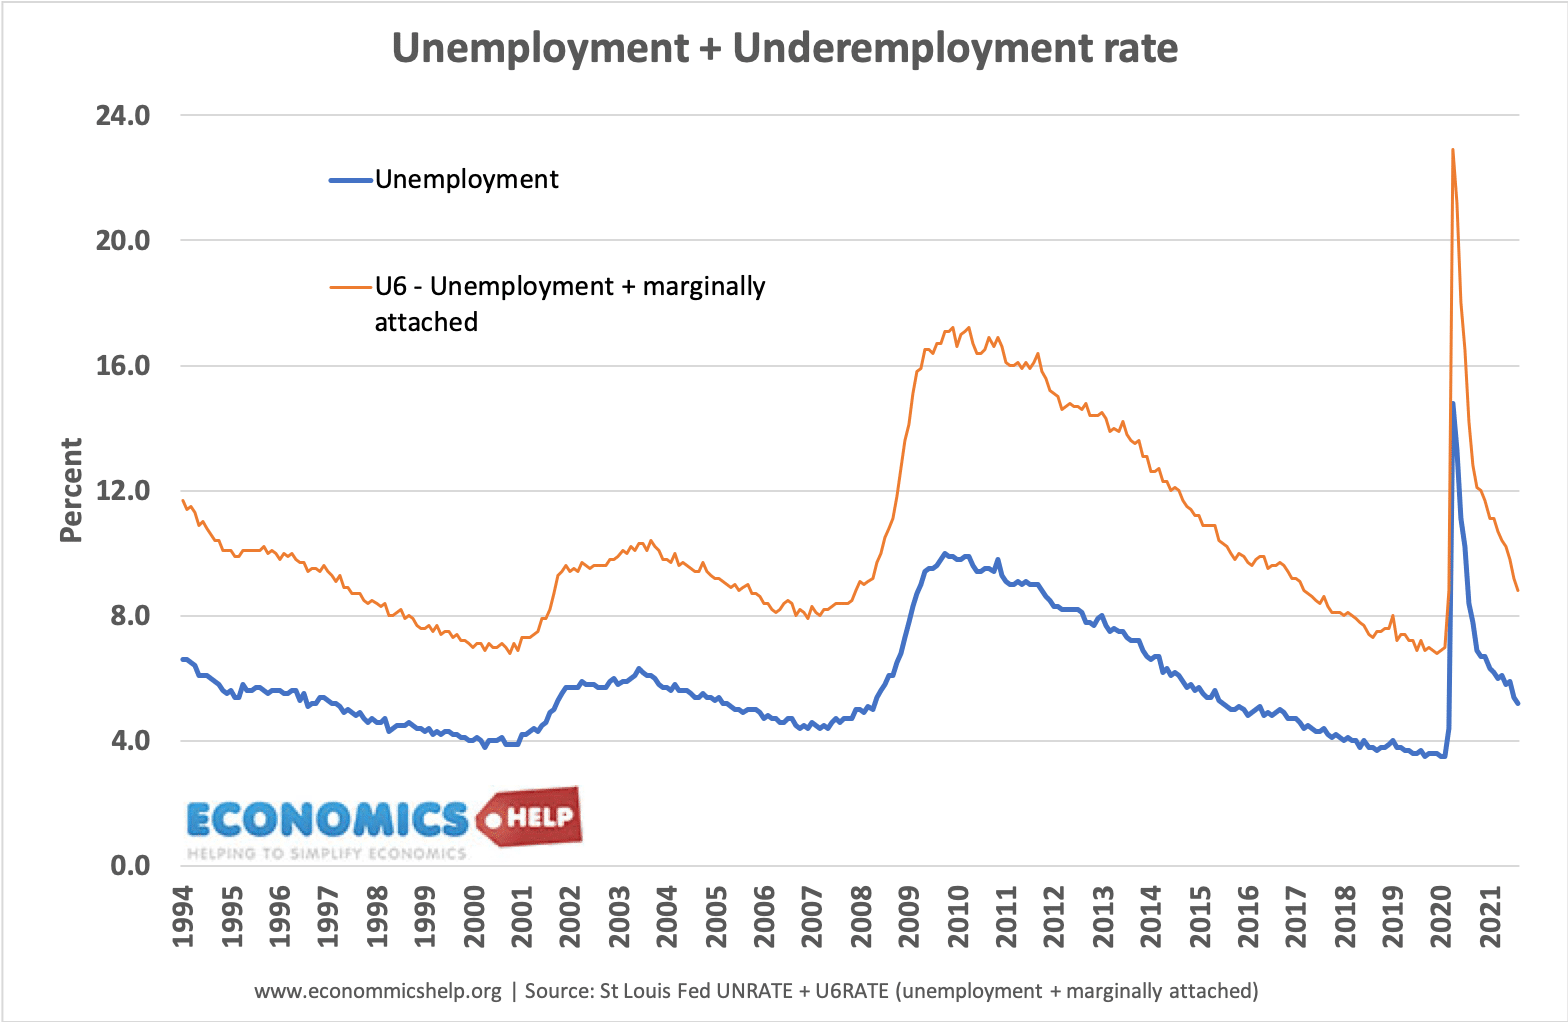
This is a reflection of those who are unemployed and under-employed. The official definition of U6 is those who are ‘marginally attached to the labor force’ – i.e. those who are working part-time, less hours than they would like or not properly participating in the labor force.
Related