Source: OECD
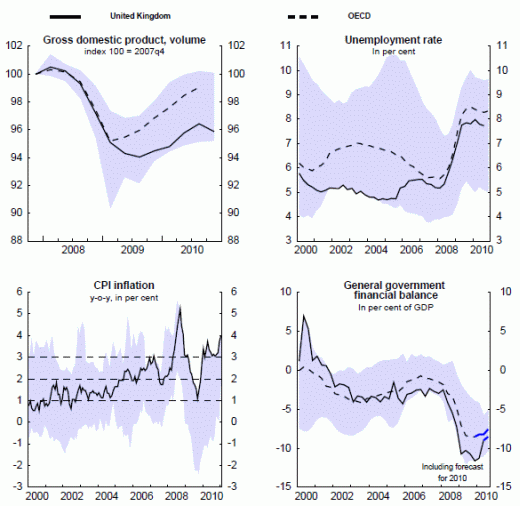
The shaded area represents the range of statistics amongst OECD countries from highest to lowest.
The OECD have recently published a report on the UK economy. These graphs illustrate how the UK is performing against other OECD Countries.
Economic Growth (GDP index)
During 2008, the UK’s decline in GDP was similar to the rest of the OECD. This was despite the credit crunch hitting the UK more than others because of our exposure to financial markets.
Since the beginning of 2009, the UK recovery has been recovering at a slower pace than our main competitors. This is partly because of the pace of the government’s plan to reduce the budget deficit.
Unemployment
In the early part of 2000s, the UK had one of the lowest rates of unemployment. Since the recession, unemployment in the UK has increased to 8%
Inflation
Despite the sluggish growth in the UK, the UK has one of the highest inflation rates. This is partly caused by the devaluation of the Pound Sterling which increases price of imports. But, this is only part of the reason. Rises in oil prices have also affected other countries too.
General government Financial Balance (Budget Deficit)
In 2000, the UK had the best financial balance with a surplus. By 2009, this had deteriorated to a deficit of 10% of GDP – one of the biggest deficits in the OECD.

