A typical supply curve shows an increase in supply as wages rise. It slopes from left to right.
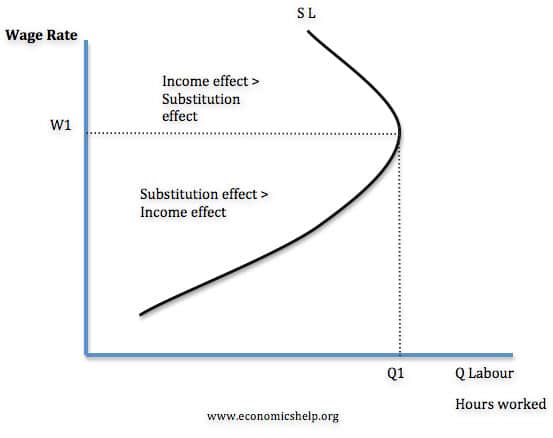
However, in labour markets, we can often witness a backward bending supply curve. This means after a certain point, higher wages can lead to a decline in labour supply. This occurs when higher wages encourage workers to work less and enjoy more leisure time.
Diagram of Backward Bending Supply Curve
There are two effects related to determining supply of labour.
- The substitution effect states that a higher wage makes work more attractive than leisure. Therefore, in response to higher wages, supply increases because work gives greater remuneration.
- The income effect states that a higher wage means workers can achieve a target income by working fewer hours. Therefore, if wages increase, it becomes easier to get enough income through working fewer hours.
When does the labour curve begin to slope backwards?
It will depend on an individual:
- If an individual has only modest demands and is interested in leisure pursuits. His goal may be to gain £30,000 a year and then after that maximise leisure time. In this case, after wages increase above £30,000, the income effect dominates, and with higher wages, he can afford to have more time off work.
- If an individual has large expenses and little interest in leisure pursuits, the substitution effect is likely to have more significance. If wages increase, it gives an increased incentive to work longer hours as he can gain increased income and buy more goods.
Other factors affecting labour supply
- Job contracts. In the real world, workers cannot easily choose the exact number of hours. Many employees are on fixed contracts. Even if wages rise, they may not have the option of working five fewer hours per week.
- The motivation for work. Employees are motivated by many factors other than hourly wages. Sometimes workers may stay at a job until they have the satisfaction of completing it. These kinds of motivations can outweigh wages.
Backward bending supply curve and the Laffer curve
The backward bending supply curve has implications for tax policy.
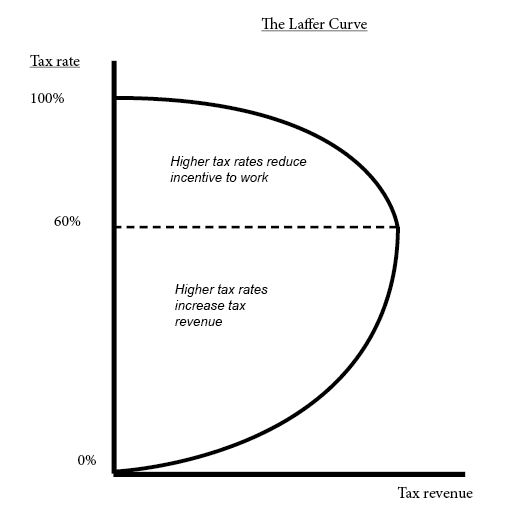
- The Laffer curve suggests that at certain tax rates – cutting income tax leads to an increase in tax revenue.
- The argument is that lower tax rates – and effectively higher wages increase the incentive to work.
- The Laffer curve assumes that the substitution effect dominates. Cut taxes – higher wages – supply increases and therefore the government can gain increased tax revenue from cutting taxes.
- However, if the supply curve is backward bending, then cutting taxes may not increase labour supply. It is possible some workers may respond to the tax cut by working less – they can gain their target income by working fewer hours.
Empirical studies on the backward bending supply curve
An investigation into the Canadian Labour market found empirical evidence of a backward supply curve for labour, especially amongst female workers.
“The wage has a significant positive effect on hours of work until a turning point of negative $10.9/hour is reached, and beyond this value wage has a negative impact on hours of work. This means that hours of work increase with wage at a decreasing rate and this relation gives a backward-bending supply of labour for Canadian women. The elasticity at the mean hours and wage is -0.02. Rahman, Adib J. (2013)
The study also found
- The substitution effect is greater among with who live alone – compared to women who live with partner earning wage
- Young women are more likely to have stronger substitution effect and respond to higher wages by supplying more labour
Related
References
Rahman, Adib J. (2013) “An econometric analysis of the “backward-bending” labour supply of Canadian women,” Undergraduate Economic Review: Vol. 10: Iss. 1, Article 6.


Can you please briefly explain leisure time and human factor in this graph
Supposed that in a monopoly union framework, the union maximize it’s wage bill and a straight line can approximate the firm labour demand curve
a) What happens to the level of employment and the wage paid if demand in the product market increases? what happens to profit?
Why ppc is backward bending