This is a theory which estimates the likely utility of an action – when there is uncertainty about the outcome. It suggests the rational choice is to choose an action with the highest expected utility.
This theory notes that the utility of a money is not necessarily the same as the total value of money. This explains why people may take out insurance. The expected value from paying for insurance would be to lose out monetarily. But, the possibility of large-scale losses could lead to a serious decline in utility because of the diminishing marginal utility of wealth.
Expected value
Expected value is the probability-weighted average of a mathematical outcome.
For example, suppose:
- A lottery ticket costs $20.
- The probability of winning the $2000 prize is 0.5%
- The likely value from having a lottery ticket will be the outcome x probability of the event occurring.
- Therefore, expected value = 0.005 x 2000 = $10
The expected value of owning a lottery ticket is $10. With an infinite number of events, on average, this is the likely payout. Of course, we may be lucky or maybe unlucky if we play only once.
Since the ticket costs $20, it seems an illogical decision to buy – because the expected value of buying a ticket is $10 – a smaller figure than the cost of purchase $20.
Expected value of a university degree
Suppose we decide to study for three years to try and gain an economic degree. A good degree is likely to lead to a higher paying job but there is no guarantee. We may fail the degree or the jobs market may turn against a surplus of graduates.
Therefore, we may estimate we have a 0.7 chance of gaining an extra $250,000 earnings in our lifetime. In this case, the expected utility of an economics degree is $175,000.
From expected value to expected utility
In 1728, Gabriel Cramer wrote to Daniel Bernoulli:
“the mathematicians estimate money in proportion to its quantity, and men of good sense in proportion to the usage that they may make of it.”
In other words, an extra $1,000 does not always have the same impact on our marginal utility.
If you are poor and your income rises from $1,000 a year to $2,000 a year this will have a big improvement in utility and your quality of life.
However, if you are already rich and your income rises from $100,000 to $101,000 a year, the improvement in utility is small.
Therefore, if you are earning $100,000 a year, it makes sense to be risk-averse about the small possibility of losing all your wealth. By spending $1,000 a year on insurance, you lose $1,000 but protect against that limited possibility of losing everything.
The loss in utility from spending that extra $1,000 is small. But, protecting against the loss of everything enables protection against a devastating loss of livelihood.
Bernoulli in Exposition of a New Theory on the Measurement of Risk (1738) argued that expected value should be adjusted to expected utility – to take into account this risk aversion we often see.
Bernoulli noted most would pay a risk premium (losing out on expected value) in order to insure against events of low probability but very potential high loss.
Logic of insurance
- Suppose the chance of house being destroyed by lightning is 0.0001, but if it is destroyed you lose $300,000.
- The expected value of your house is therefore 0.9999 x 300,000 = $299,970.
- The expected loss of your house is just $30.
- An insurance company may be willing to insure against the loss of your 300,000 house for $100 a year.
- According to the expected value, you should not insure your house. The cost of insurance $100 is far greater than the expected loss $30 from the house being destroyed.
- However, the expected utility is different.
- If you are wealthy, paying $100 only has a small marginal decline in utility.
- However, if you were unlucky and lost your house the loss of everything would have a corresponding greater impact on utility.
Risk aversion and the diminishing marginal utility of wealth
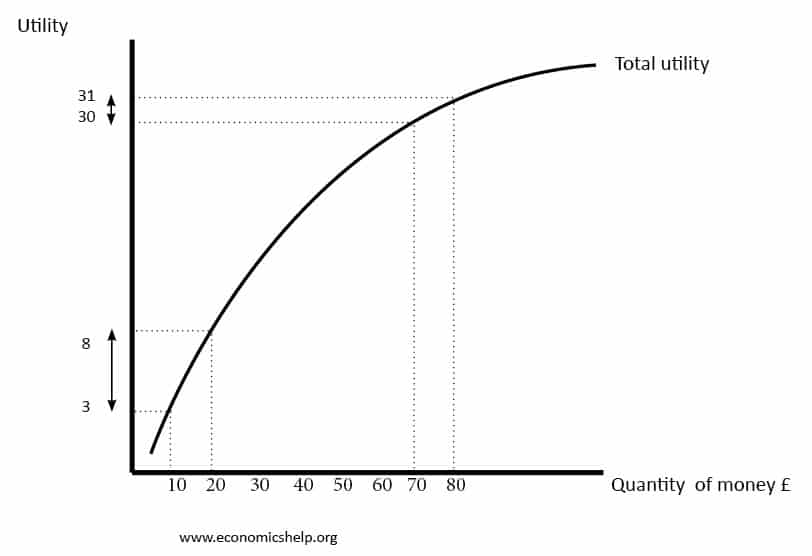
However, an increase in wealth from £70 to £80 leads to a correspondingly small increase in utility (30 to 31).
This concave graph shows the diminishing marginal utility of money and a justification for why people may exhibit risk aversion for potentially large losses with small probabilities.
Related