Economic growth means an increase in national income, but does economic growth actually help to reduce relative poverty and income inequality – or can economic growth exacerbate existing income inequalities?
There are two types of poverty:
- Relative poverty: This is when income is a certain percentage less than the average income. For example, in the UK relative poverty is defined as income 50% less than average incomes. Therefore a rise in economic growth and average incomes will cause a change in what constitutes relative poverty.
- In 1920, relative poverty may have been an income of less than £800 a year
- In 2017, relative poverty may be income of less than £12,000 a year
Economic growth may or may not reduce relative poverty; it depends on the income distribution of the growth.
- Absolute Poverty: This is an income below a certain level necessary to maintain a minimum standard of living. (e.g. enough money to buy the basic necessities of food, shelter and heat.
- Therefore, economic growth should reduce absolute poverty, so long as the poorest can gain some increase in living standards from the nation’s growth.
Does Economic Growth reduce Relative Poverty?
Economic growth will reduce income inequality if:
- Wages of the lowest paid rise faster than the average wage.
- Government benefits, such as; unemployment benefits, sickness benefits and pensions are increased in line with average wages.
- Economic growth creates job opportunities which reduce the level of unemployment. Unemployment and lack of employment are one of the biggest causes of relative poverty.
- Minimum wages are increased in line with average earnings.
- Progressive taxes redistribute income. Progressive taxes such as higher rates of income tax will take a higher percentage of income from the rich; this can be used to fund social spending, such as health care, education and welfare benefits which help to reduce income inequality.
Why economic growth may not reduce income inequality
- Economic growth often creates the best opportunities for those who are highly skilled and educated. In recent years, in the UK, we have seen faster wage growth for highly paid jobs than unskilled jobs.
- Modern economies are creating an increased number of part-time/flexible service sector jobs. In these sectors, wages have been lagging behind average earnings.
- In the UK, government benefits have been indexed linked. This means increased in line with inflation. This means that benefit incomes have fallen behind average earnings.
- Interest-bearing wealth. The wealthy gain interest and dividends from their assets. This rent, interest and dividends can be used to re-invest in increasing their wealth. For the wealthy, it is a wealth creating cycle – which increases their share of income. The economist Thomas Piketty argued that without government intervention the rate of return from wealth would lead to widening income and wealth inequality.
Economic growth will not necessarily solve unemployment. For example, growth cannot solve structural and frictional unemployment; this is unemployment caused by lack of skills and geographical immobilities.
Evidence

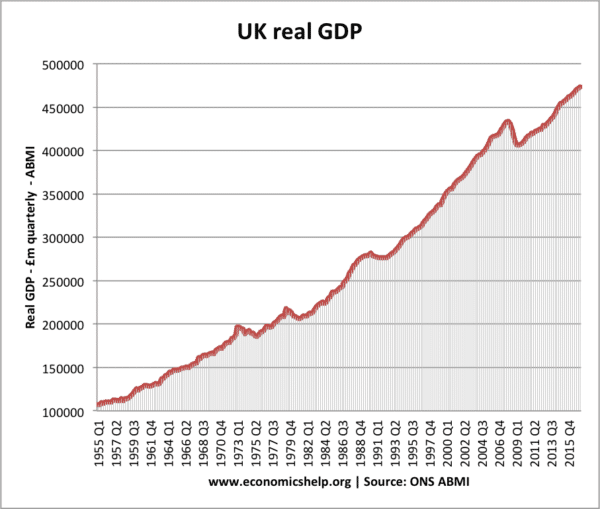
The UK has seen a sustained rise in real GDP since the post-war period.

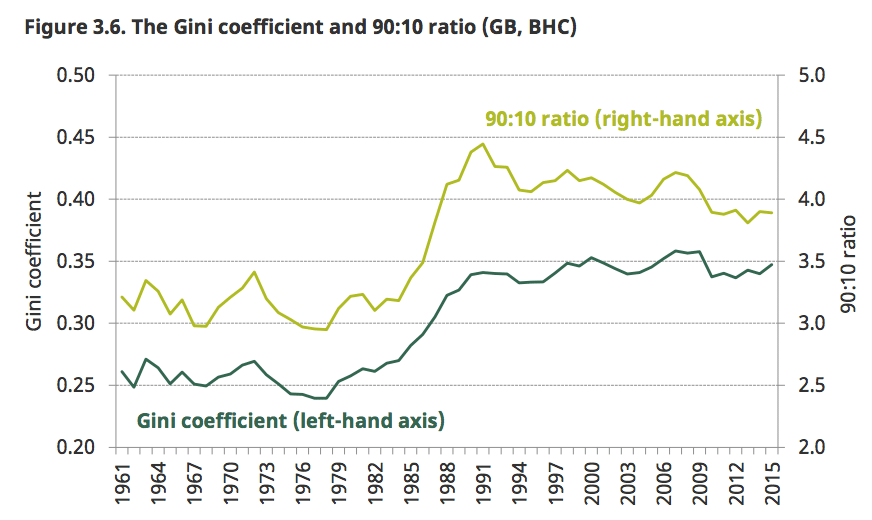
The Gini coefficient measures the level of inequality.
[The 90: 10 ratio measures the ratio of individuals with an income higher than 90% of the population and asks how many times greater their income is than that of someone with an income higher than only 10% of the population.]
The main trend in inequality is the rise in inequality during the 1980s. This was due to a few factors
- Rise in unemployment following recession of 1980/81
- Rise in non-working households – either unemployed or leaving labour market (e.g. long-term sickness and disability)
- Deindustrialisation saw a decline of high paying manual labour, replaced with more flexible labour market and low wage jobs.
- A rise in incomes of highest paid, e.g. higher incomes of those working in the finance sector.
- Changes in the tax system which saw largest tax cuts for high-income earners.
- Rise in wealth – house prices
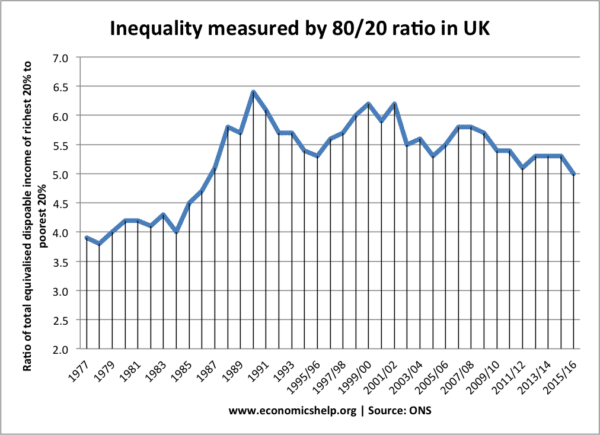
Inequality measured by 80-20 ratio

The fall in the 80/20 ratio reflects the fact unemployment has fallen and more people are in employment. There has also been an improvement in income of pensioners. Pension poverty has fallen due to more generous state benefits.
Why does Gini coefficient show more inequality than 80:20 ratio
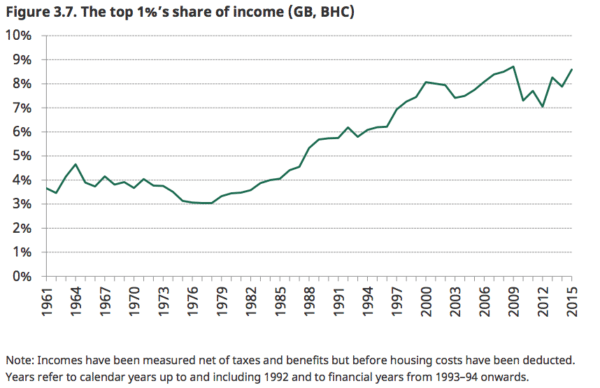
The Gini coefficient captures the inequality of the top 1% of the population. The 80:20 ratio measures income of those with top 20% income and ignores the impact of the top 1% of income earners (and in fact the top 0.1% of income earners)
Share of top 1% income earners
Source: IFS
Related

