Oligopoly Diagram
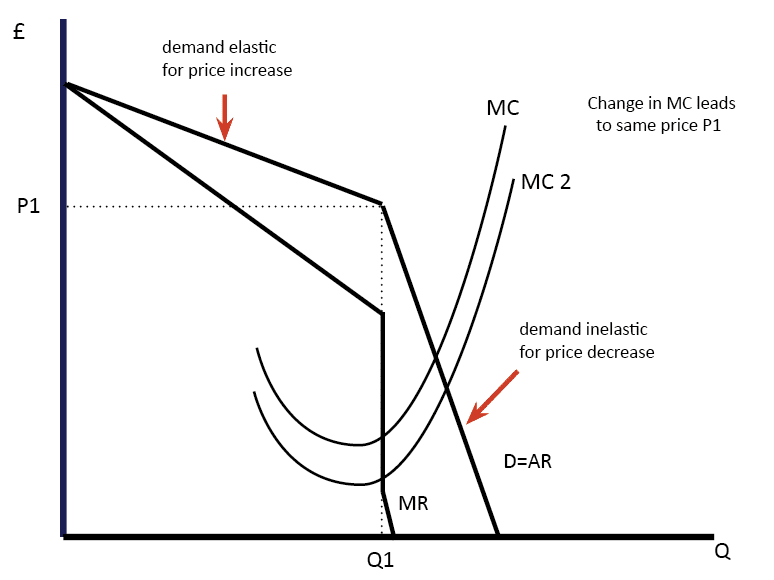
There are different diagrams that you can use to explain 0ligopoly markets. It is important to bear in mind, there are different possible ways that firms in Oligopoly can behave. 1. Kinked Demand Curve Diagram In the kinked demand curve model, the firm maximises profits at Q1, P1 where MR=MC. Thus a change in MC, …

