A negative externality is a cost imposed on a third party from producing or consuming a good.
This is a diagram for negative production externality. This shows the divergence between the private marginal cost of production and the social marginal cost of production.
A negative externality leads to overconsumption and deadweight welfare loss.
Diagram for Negative Externality
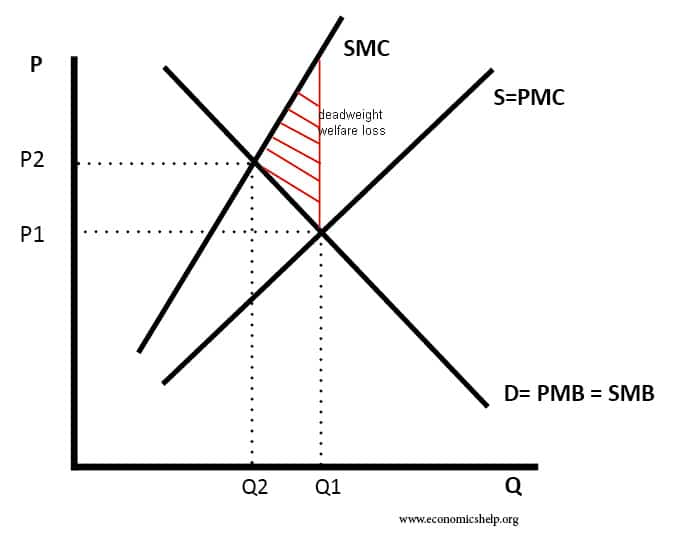
- In a free market, the output is where S (PMC) = D (PMB) @Q1.
- In a free market, it is assumed that people ignore the external costs. (e.g. when driving you consider the cost of petrol, but, not the fact that congestion and pollution increases causing problems for others.)
Because of externalities such as pollution, the social cost of driving is higher than the private cost. Therefore, in a free market we get overconsumption. This makes common sense, just think of rush hour traffic – there tends to be overconsumption of driving because people ignore the costs to others.
Socially efficient level of output
The socially efficient level of output occurs where the Social marginal cost (SMC) = Social Marginal Benefit (SMB). This occurs at output Q2.
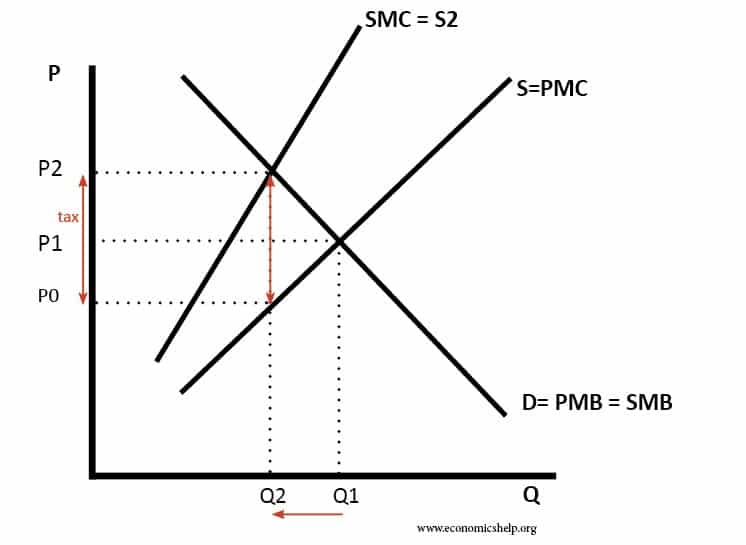
The easiest policy to achieve the socially efficient level of output Q2 is using tax. The tax equals the external cost of production.
Negative externality of consumption
This occurs when consuming a good causes a harmful effect to a third party. In this case, the social benefit is less than the private benefit.
Examples of negative externalities of consumption
- Consuming alcohol leads to an increase in drunkenness, increased risk of car accidents and social disorder.
- Consuming loud music late at night keeps your neighbours awake.
- Consuming cigarettes causes passive smoking to others in the vacinity.
Diagram of negative externality in consumption
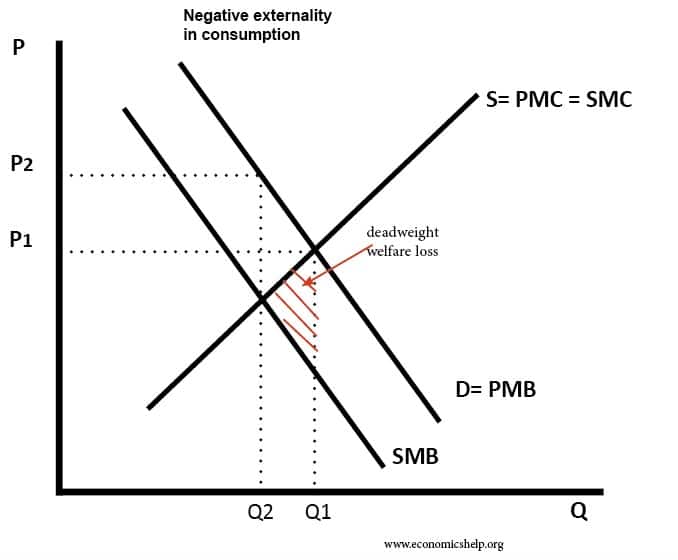
- In a free market, we get Q1 output. But at this output, the social marginal cost is greater than the social marginal benefit.
- The red triangle is the area of dead-weight welfare loss.
- Social efficiency occurs at a lower output (Q2) – where social marginal benefit = social marginal cost.
See