Interest Rate Forecasts 2025
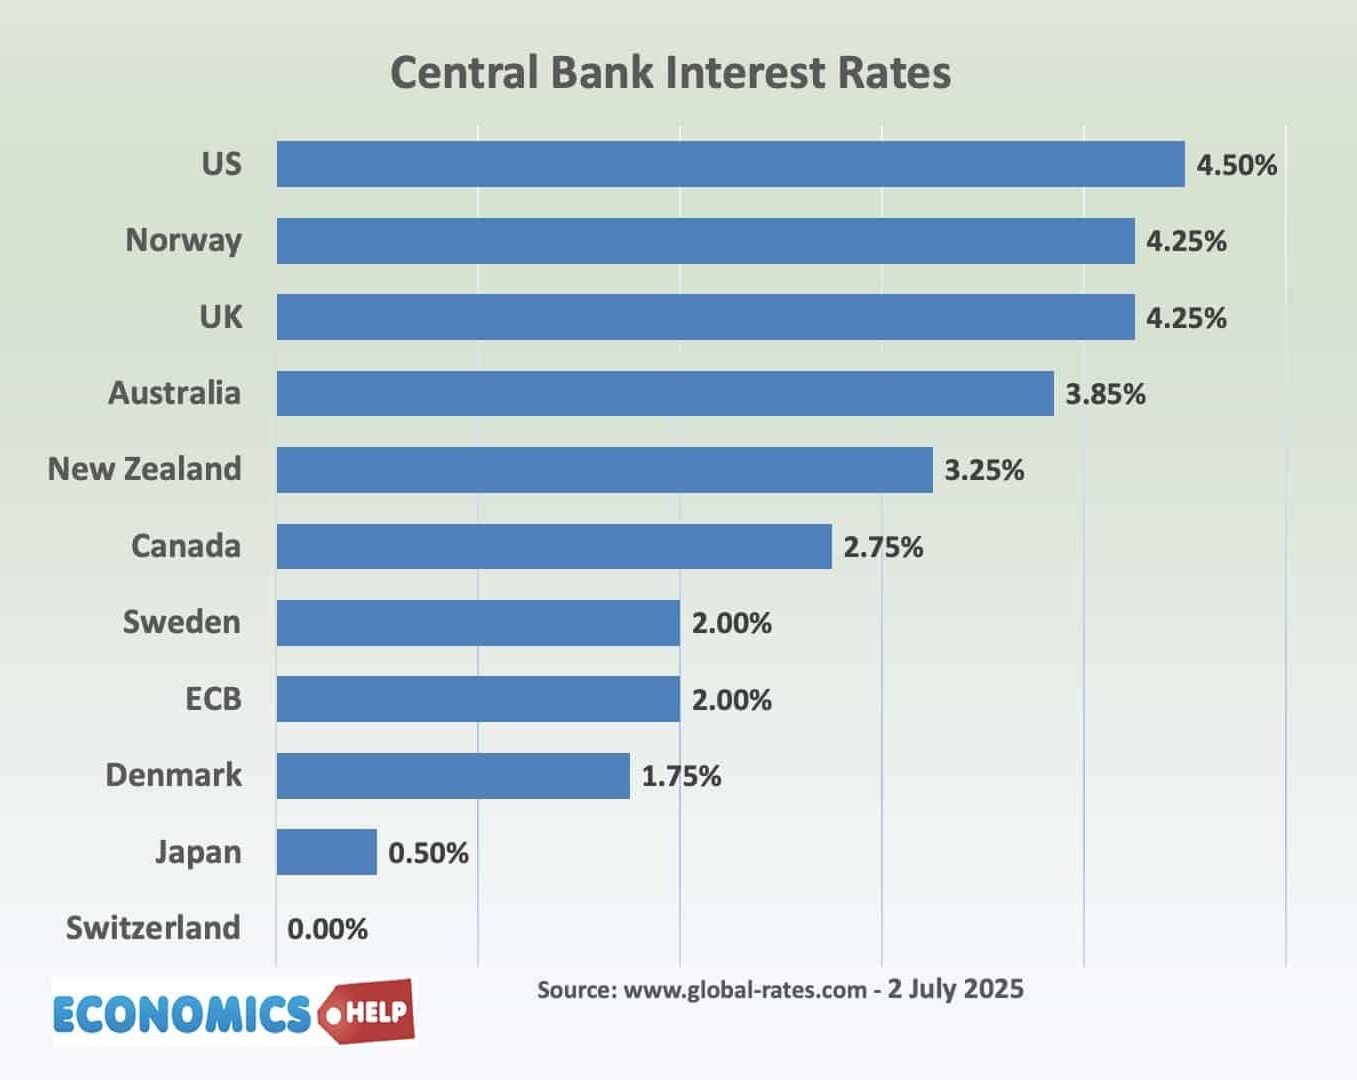
Recently, Donald Trump told the chair of the Federal Reserve that the US should be cutting interest rates like other countries. And it is true the UK and US have been slow to cut interest rates. They are now double the level in Europe and Canada. Although Rachel Reeves is unlikely to be sending notes …