In the past decade there has been a divergence between house prices in different parts of the UK. In particular, house prices in London and surrounding areas has rocketed to unprecedented levels.
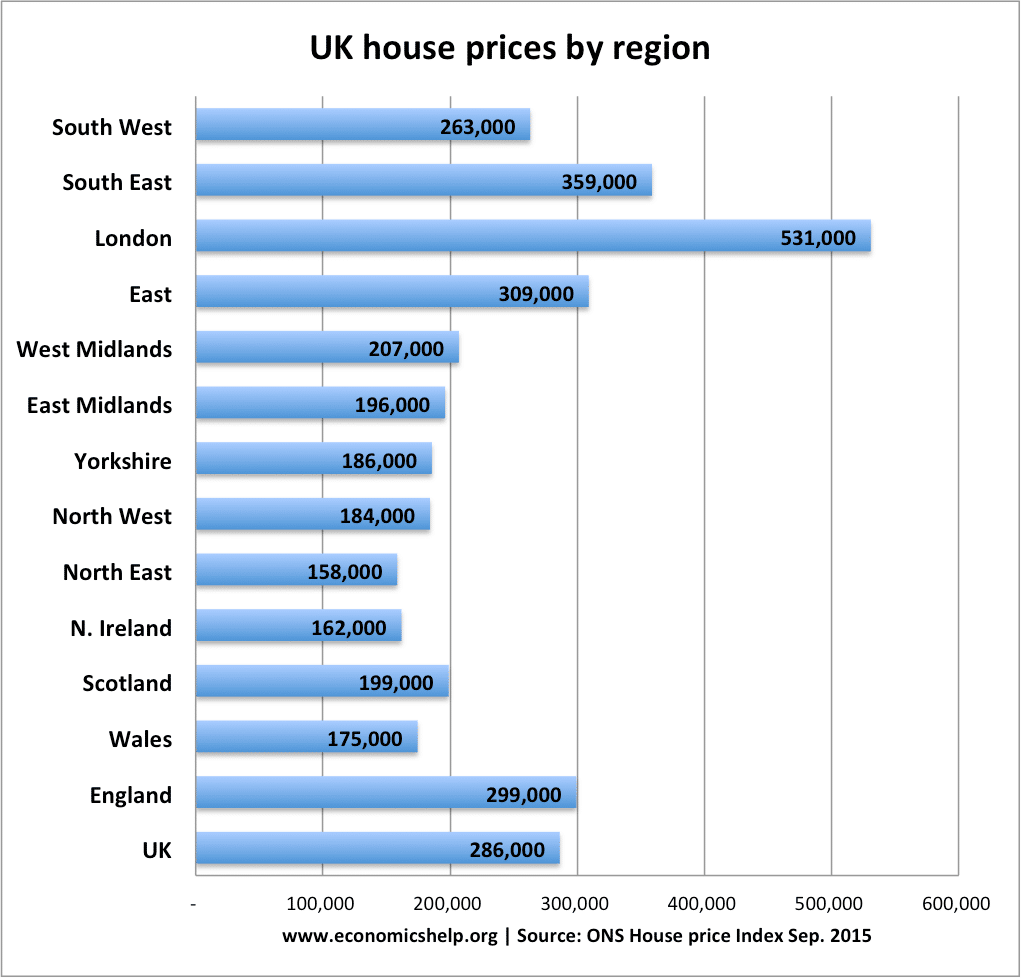
According to the ONS, average mix-adjusted house prices in September 2015 stood at £299,000 in England, £175,000 in Wales, £199,000 in Scotland and £162,000 in Northern Ireland.
Most expensive region
The most expensive region is unexpectedly London – with average house price standing at £531,000
Cheapest region
North East had the lowest average house price at £158,000.
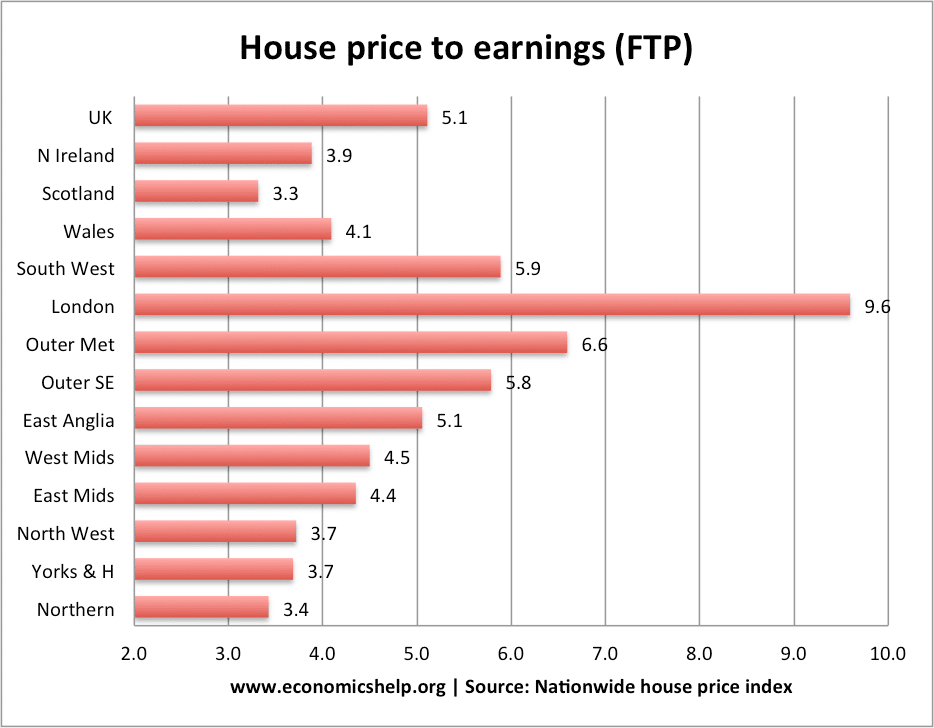
House price to earnings ratio
Part of the difference between house prices is the greater availability of jobs in London. London salaries are higher than the national average. However, the difference in house prices is only partially caused by differences in wages. This shows that there are large differences in the ratio of house price to income ratios for first time buyers in different regions.
Changes in regional house prices
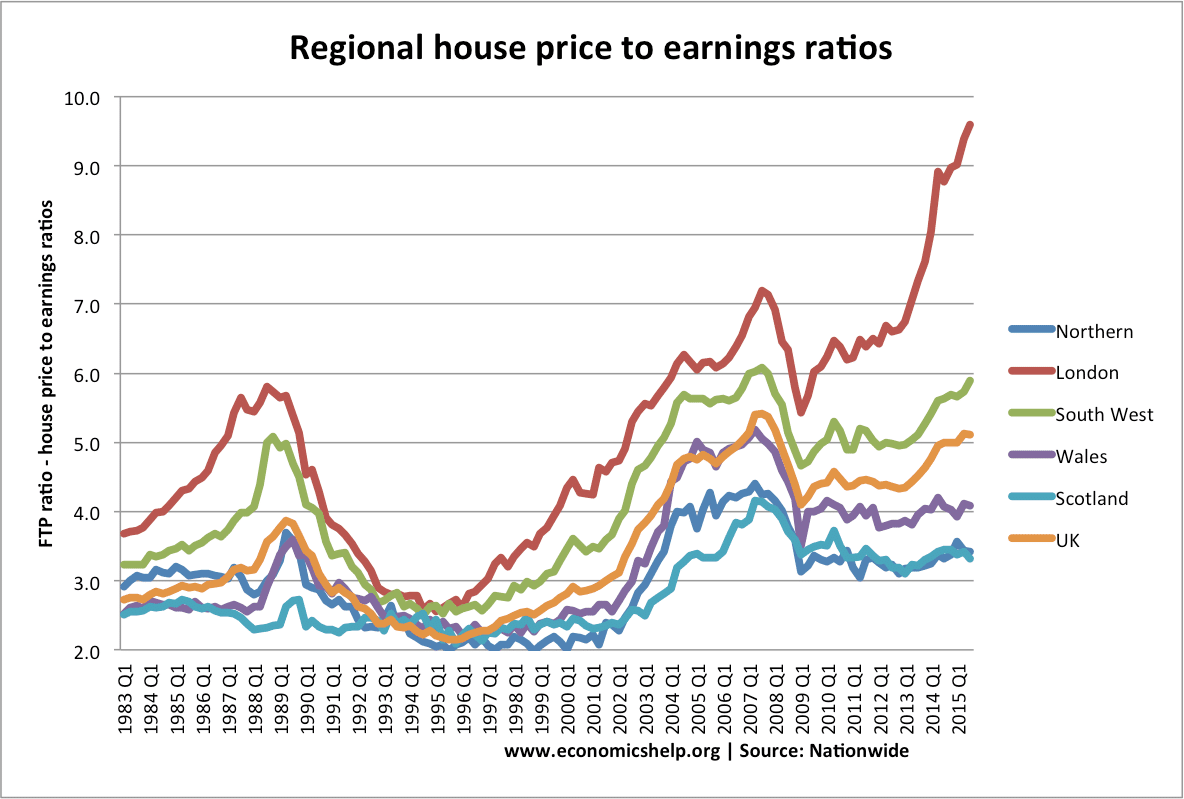
It is interesting that in mid-1990s, regional house prices converge with house price to income ratios falling below 3.0 in all regions. But, since the mid-1990s, the gap has widened. It is fair to say house prices are more volatile in London and the South West than elsewhere.
Reasons for house price differences
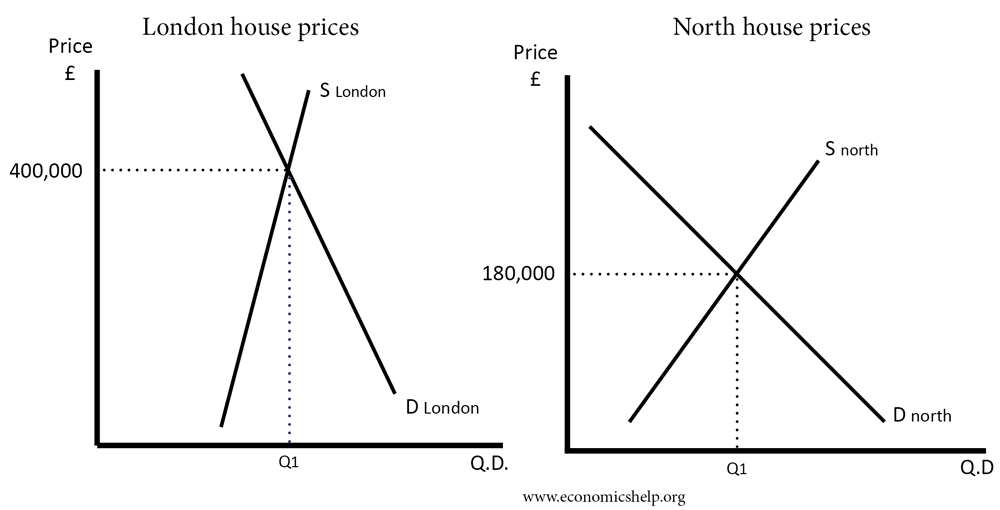
Limited supply in London and south. Simple economics suggests that if demand is greater than supply, prices will rise. London and the south are seeing a rise in population, a rise in demand for housing, yet supply cannot keep up – pushing prices higher. In the north, Scotland and Wales, there is less population growth and the pressures on housing are much less.
Difference in population growth rates. The population of London is growing faster than elsewhere.
Speculation and buy to let. Rising house prices in the south has attracted buy to let investors – foreign investors looking to benefit from rising asset prices. It is a self-perpetuating circle with rising house prices encouraging further demand.
Regional cost of renting
The most expensive places to rent in UK
| Local authority name | All monthly rents |
| Kensington and Chelsea | 2,492 |
| Westminster | 2,318 |
| City of London | 2,145 |
| Camden | 1,885 |
| Islington | 1,733 |
| Hackney | 1,690 |
| Hammersmith and Fulham | 1,668 |
| Tower Hamlets | 1,647 |
| Wandsworth | 1,647 |
| Richmond upon Thames | 1,595 |
| Lambeth | 1,560 |
| Brent | 1,510 |
| Southwark | 1,473 |
| Merton | 1,450 |
| Haringey | 1,400 |
| Barnet | 1,400 |
| Hounslow | 1,400 |
| Ealing | 1,395 |
| Harrow | 1,350 |
| Newham | 1,325 |
| Greenwich | 1,300 |
| Kingston upon Thames | 1,295 |
| Elmbridge | 1,295 |
| South Bucks | 1,275 |
| Lewisham | 1,250 |
| Enfield | 1,250 |
| Chiltern | 1,250 |
| Epsom and Ewell | 1,250 |
| Waltham Forest | 1,225 |
| Guildford | 1,225 |
| Hertsmere | 1,200 |
| Three Rivers | 1,200 |
| Redbridge | 1,200 |
| Windsor and Maidenhead | 1,200 |
| Tandridge | 1,200 |
| St Albans | 1,195 |
| Bromley | 1,195 |
| Sevenoaks | 1,175 |
| Mole Valley | 1,175 |
| Woking | 1,175 |
| Runnymede | 1,173 |
| Barking and Dagenham | 1,150 |
| Hillingdon | 1,150 |
| Oxford | 1,150 |
| Cambridge | 1,100 |
| Brentwood | 1,100 |
| Epping Forest | 1,100 |
| Croydon | 1,100 |
| Sutton | 1,100 |
| Brighton and Hove | 1,100 |
| Wokingham | 1,100 |
| Spelthorne | 1,100 |
| Watford | 1,050 |
| Welwyn Hatfield | 1,050 |
| Reigate and Banstead | 1,050 |
| Waverley | 1,050 |
| Surrey Heath | 1,025 |
| Bexley | 1,000 |
| Havering | 1,000 |
| Dacorum | 975 |
| Hart | 975 |
| Winchester | 975 |
| Bracknell Forest | 950 |
| Wycombe | 950 |
| Tonbridge and Malling | 950 |
| South Oxfordshire | 950 |
| Horsham | 950 |
| Mid Sussex | 950 |
| Bath and North East Somerset | 940 |
| Broxbourne | 925 |
| East Hertfordshire | 925 |
| Reading | 925 |
| Crawley | 925 |
| Forest Heath | 923 |
| Uttlesford | 900 |
| Lewes | 900 |
| Tunbridge Wells | 900 |
| Vale of White Horse | 900 |
| Chichester | 895 |
| South Cambridgeshire | 885 |
| West Berkshire | 880 |
| Rochford | 875 |
| Basingstoke and Deane | 860 |
| Thurrock | 850 |
| Basildon | 850 |
| Chelmsford | 850 |
| North Hertfordshire | 850 |
| Slough | 850 |
| Test Valley | 850 |
| Canterbury | 850 |
| Cherwell | 850 |
| West Oxfordshire | 850 |
| Bristol, City of | 850 |
| Dartford | 848 |
| Cotswold | 845 |
| Rushmoor | 828 |
| Castle Point | 825 |
| Harlow | 825 |
| Milton Keynes | 825 |
| Aylesbury Vale | 825 |
| Wealden | 825 |
| Adur | 825 |
| Christchurch | 825 |
| East Dorset | 825 |
| Central Bedfordshire | 807 |
| South Northamptonshire | 800 |
| East Hampshire | 800 |
| Eastleigh | 800 |
| New Forest | 800 |
| South Gloucestershire | 800 |
| Stevenage | 795 |
| Fareham | 795 |
| Maidstone | 795 |
| Havant | 785 |
| Warwick | 775 |
| Poole | 765 |
| Trafford | 750 |
| Stratford-on-Avon | 750 |
| Solihull | 750 |
| Bedford | 750 |
| Luton | 750 |
| Southend-on-Sea | 750 |
| East Cambridgeshire | 750 |
| Braintree | 750 |
| Maldon | 750 |
| Southampton | 750 |
| Gravesham | 750 |
| Arun | 750 |
| Purbeck | 750 |
| Exeter | 745 |
| Worthing | 740 |
| St Edmundsbury | 725 |
| Medway | 725 |
| Ashford | 725 |
| Wiltshire | 725 |
| South Hams | 725 |
| Isles of Scilly | 723 |
| Tewkesbury | 715 |
| West Dorset | 710 |
| York | 700 |
| Harrogate | 700 |
| Portsmouth | 700 |
| Rother | 700 |
| Huntingdonshire | 695 |
| Colchester | 695 |
| Bournemouth | 695 |
| Cheltenham | 695 |
| Swale | 678 |
| Gosport | 677 |
| Rutland | 675 |
| Swindon | 675 |
| Stroud | 675 |
| East Devon | 670 |
| Babergh | 665 |
| Daventry | 660 |
| Manchester | 650 |
| Stockport | 650 |
| Harborough | 650 |
| Rugby | 650 |
| Birmingham | 650 |
| Bromsgrove | 650 |
| Wychavon | 650 |
| Tendring | 650 |
| Broadland | 650 |
| Mid Suffolk | 650 |
| Eastbourne | 650 |
| Cornwall | 650 |
| North Somerset | 650 |
| Teignbridge | 650 |
| North Dorset | 650 |
| Northampton | 640 |
| Lichfield | 635 |
| Derbyshire Dales | 625 |
| Blaby | 625 |
| Oadby and Wigston | 625 |
| East Northamptonshire | 625 |
| South Staffordshire | 625 |
| Malvern Hills | 625 |
| South Norfolk | 625 |
| Suffolk Coastal | 625 |
| Weymouth and Portland | 625 |
| Mendip | 625 |
| Redditch | 620 |
| Norwich | 610 |
| Newcastle upon Tyne | 600 |
| Cheshire West and Chester | 600 |
| South Lakeland | 600 |
| Leeds | 600 |
| Breckland | 600 |
| Isle of Wight | 600 |
| Thanet | 600 |
| Mid Devon | 600 |
| South Somerset | 600 |
| Taunton Deane | 600 |
| West Devon | 598 |
| Cheshire East | 595 |
| Ribble Valley | 595 |
| Wellingborough | 595 |
| Rushcliffe | 595 |
| Tamworth | 595 |
| North Warwickshire | 595 |
| Worcester | 595 |
| Ipswich | 595 |
| North Devon | 595 |
| Forest of Dean | 595 |
| Gloucester | 590 |
| Salford | 575 |
| Hambleton | 575 |
| North West Leicestershire | 575 |
| Boston | 575 |
| South Holland | 575 |
| Kettering | 575 |
| Stafford | 575 |
| Coventry | 575 |
| Peterborough | 575 |
| North Norfolk | 575 |
| Sedgemoor | 575 |
| Herefordshire, County of | 570 |
| Torridge | 570 |
| Shepway | 569 |
| North Kesteven | 565 |
| South Kesteven | 565 |
| Dover | 565 |
| Corby | 563 |
| Torbay | 563 |
| Melton | 560 |
| Fenland | 560 |
| Warrington | 550 |
| Bury | 550 |
| Fylde | 550 |
| South Ribble | 550 |
| Craven | 550 |
| Richmondshire | 550 |
| Ryedale | 550 |
| Selby | 550 |
| Sheffield | 550 |
| South Derbyshire | 550 |
| Hinckley and Bosworth | 550 |
| Broxtowe | 550 |
| Gedling | 550 |
| Shropshire | 550 |
| Telford and Wrekin | 550 |
| Hastings | 550 |
| Plymouth | 550 |
| Knowsley | 544 |
| Wyre | 542 |
| Wyre Forest | 540 |
| Nuneaton and Bedworth | 535 |
| Stockton-on-Tees | 525 |
| Eden | 525 |
| Chorley | 525 |
| Lancaster | 525 |
| Sefton | 525 |
| North East Derbyshire | 525 |
| Charnwood | 525 |
| East Staffordshire | 525 |
| Dudley | 525 |
| Sandwell | 525 |
| Great Yarmouth | 525 |
| Waveney | 525 |
| Blackpool | 520 |
| West Lancashire | 520 |
| Nottingham | 515 |
| Cannock Chase | 515 |
| North Tyneside | 510 |
| Gateshead | 500 |
| Halton | 500 |
| Tameside | 500 |
| Preston | 500 |
| Wirral | 500 |
| Wakefield | 500 |
| Leicester | 500 |
| High Peak | 500 |
| Lincoln | 500 |
| Newark and Sherwood | 500 |
| Walsall | 500 |
| Wolverhampton | 500 |
| Newcastle-under-Lyme | 499 |
| Redcar and Cleveland | 495 |
| Sunderland | 495 |
| Bolton | 495 |
| Oldham | 495 |
| East Riding of Yorkshire | 495 |
| Scarborough | 495 |
| Amber Valley | 495 |
| Staffordshire Moorlands | 495 |
| West Lindsey | 480 |
| Erewash | 476 |
| Northumberland | 475 |
| South Tyneside | 475 |
| Allerdale | 475 |
| Rossendale | 475 |
| St. Helens | 475 |
| North Lincolnshire | 475 |
| Doncaster | 475 |
| Rotherham | 475 |
| Bradford | 475 |
| Calderdale | 475 |
| Kirklees | 475 |
| Derby | 475 |
| Chesterfield | 475 |
| East Lindsey | 475 |
| Ashfield | 475 |
| Bassetlaw | 475 |
| Mansfield | 475 |
| Rochdale | 465 |
| County Durham | 450 |
| Hartlepool | 450 |
| Middlesbrough | 450 |
| Blackburn with Darwen | 450 |
| Barrow-in-Furness | 450 |
| Carlisle | 450 |
| Copeland | 450 |
| Wigan | 450 |
| Liverpool | 450 |
| Darlington | 440 |
| Stoke-on-Trent | 440 |
| North East Lincolnshire | 435 |
| Barnsley | 433 |
| Hyndburn | 425 |
| Pendle | 425 |
| Bolsover | 425 |
| Burnley | 400 |
| Kingston upon Hull, City of | 395 |
| West Somerset | 600 |
Source: ONS Housing Summary 2017
See also