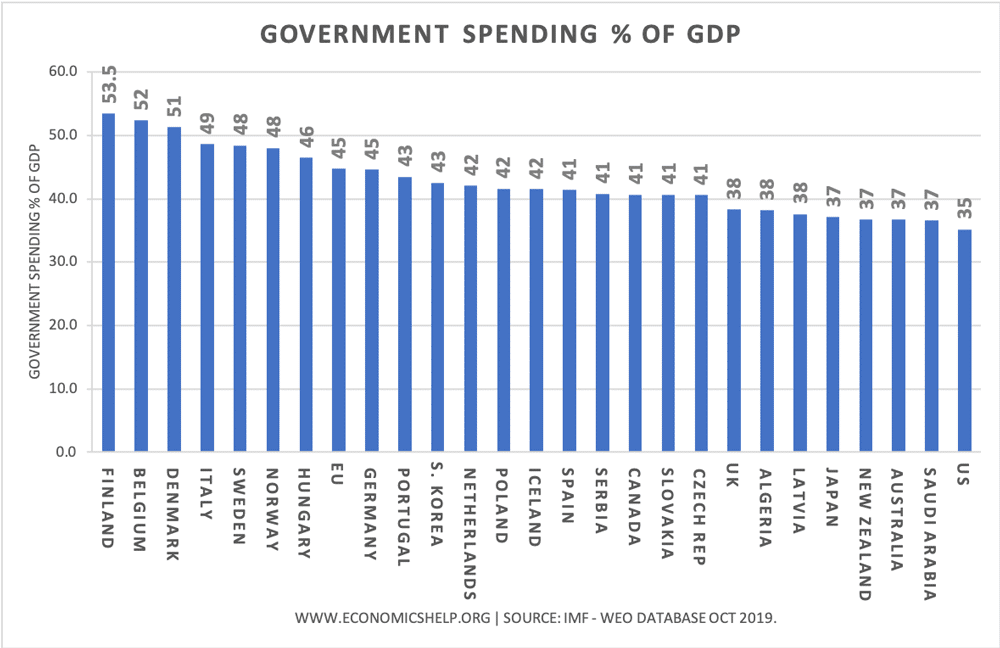
Countries with the highest government spending as a share of GDP.

The countries with the lowest government spending as a % of GDP tend to be poor developing economies.
The one notable exception is Singapore. A wealthy economy with an unusually low level of government spending as % of GDP.
(These graphs exclude some very small economies)
Quality of life index

(UK is ranked no. 17)
This quality of life index suggests a correlation between quality of life and countries with a high share of government spending as % of GDP.
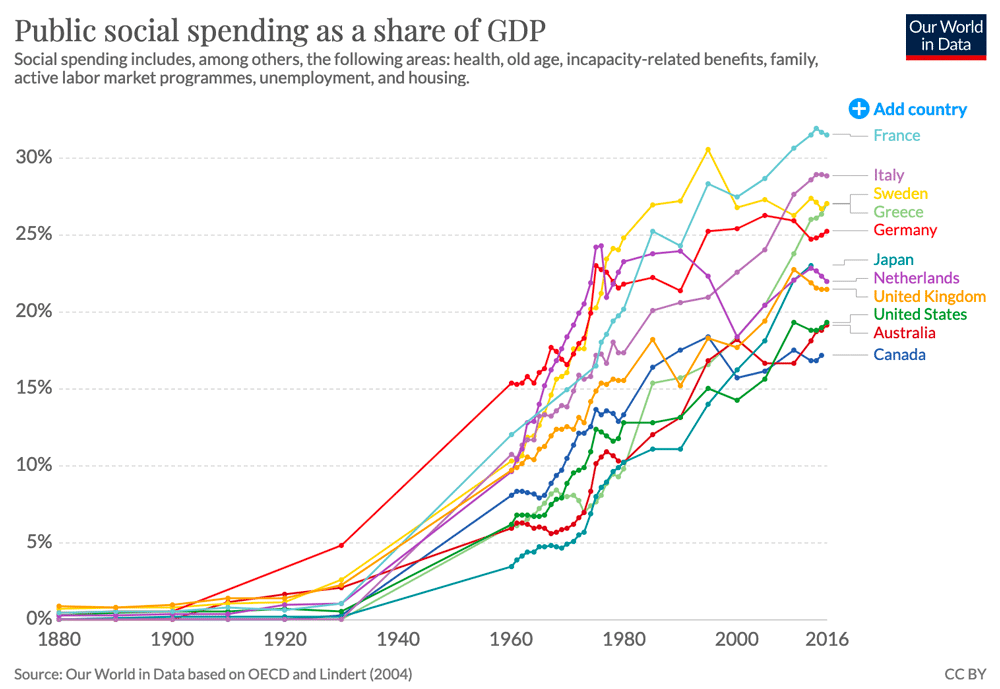
Benefits of Higher government spending
Increased government spending enables
- More public health care – an important factor in the quality of life. Good health care will also help improve life expectancy and labour productivity
- More spending on education. Another important factor in the quality of life. Increased education spending can contribute to higher labour productivity and faster economic development
- Provision of public goods, such as national defence, flood defences and protection of the environment
- Welfare benefits – providing a minimum level of income and helping to reduce absolute and relative poverty.
Potential problems of government spending
- Spending on military /defence may not lead to an increase in economic welfare but maybe a reflection of civil unrest.
- Government spending may be prone to corruption
- Government spending may be inefficient due to a lack of profit motive and incentives to be efficient.
- Crowding out of the private sector. Higher government spending can crowd out private sector spending and investment.
- Higher taxes may reduce incentives to work. Higher government spending needs higher tax revenue (or higher government borrowing. Higher taxes may create disincentives to work.
Does higher government spending improve real GDP per capita?
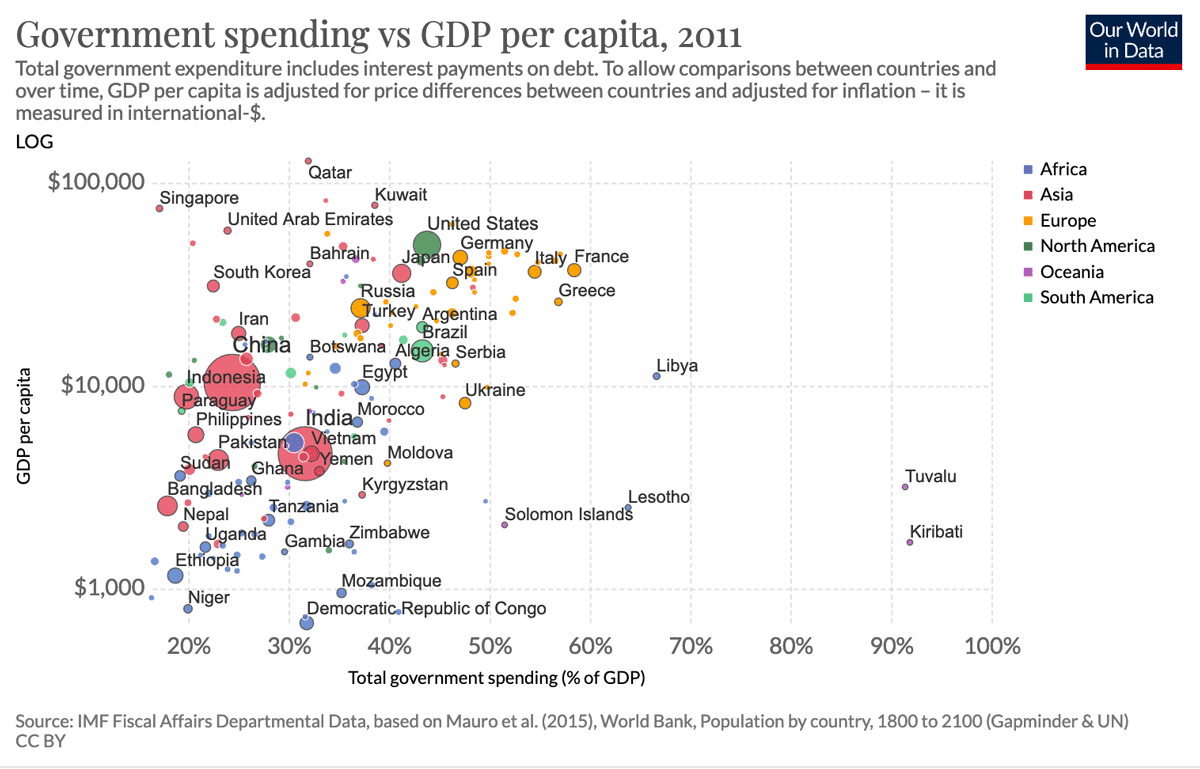
Generally, countries with higher real GDP per capita have higher levels of government spending as % of GDP. Some countries are non-typical, e.g. high real GDP of Middle East countries coming from oil and gas revenues.
There is a link but it is also important not to mix cause and effect. Economic growth generally enables an increase in public services.
Some economists claim that as the government sector grows in size in can hold back the rate of economic growth. (e.g. Rahn Curve)
Tax Revenue as a % of GDP

Full list of Government spending as % of GDP
| Country | Government expenditure | |
| (% of GDP) | ||
| 1 | Finland | 53.5 |
| 2 | Belgium | 52.4 |
| 3 | Denmark | 51.3 |
| 4 | Kuwait | 49.4 |
| 5 | Italy | 48.6 |
| 6 | Sweden | 48.4 |
| 7 | Norway | 48.0 |
| 8 | Montenegro | 47.7 |
| 9 | Lesotho | 46.5 |
| 10 | Hungary | 46.5 |
| 11 | Croatia | 46.4 |
| 12 | Oman | 45.4 |
| 13 | European Union | 44.7 |
| 14 | Germany | 44.6 |
| 15 | Cyprus | 44.5 |
| 16 | Portugal | 43.5 |
| 17 | Luxembourg | 43.1 |
| 18 | Tonga | 43.1 |
| 19 | Korea, South | 42.5 |
| 20 | Netherlands | 42.1 |
| 21 | Ukraine | 41.7 |
| 22 | Poland | 41.5 |
| 23 | Iceland | 41.5 |
| 24 | Spain | 41.3 |
| 25 | Bosnia and Herzegovina | 41.0 |
| 26 | Serbia | 40.8 |
| 27 | Canada | 40.7 |
| 28 | Slovakia | 40.6 |
| 29 | Czech Republic | 40.6 |
| 30 | Slovenia | 39.5 |
| 31 | Israel | 39.4 |
| 32 | Estonia | 39.0 |
| 33 | United Kingdom | 38.3 |
| 34 | Palau | 38.2 |
| 35 | Algeria | 38.1 |
| 36 | Latvia | 37.6 |
| 37 | Seychelles | 37.4 |
| 38 | Japan | 37.1 |
| 39 | Ecuador | 37.1 |
| 40 | Malta | 36.8 |
| 41 | New Zealand | 36.7 |
| 42 | Australia | 36.7 |
| 43 | Saudi Arabia | 36.6 |
| 44 | United States | 35.1 |
| 45 | Bulgaria | 35.0 |
| 46 | Venezuela | 34.7 |
| 47 | Turkey | 34.6 |
| 48 | Kyrgyzstan | 34.1 |
| 49 | China | 34.1 |
| 50 | Namibia | 34.0 |
| 51 | Bahrain | 33.7 |
| 52 | South Africa | 33.4 |
| 53 | Lithuania | 33.2 |
| 54 | Uruguay | 33.2 |
| 55 | Azerbaijan | 33.1 |
| 56 | South Sudan | 32.8 |
| 57 | Russia | 32.6 |
| 58 | Switzerland | 32.4 |
| 59 | Liberia | 32.4 |
| 60 | Romania | 32.2 |
| 61 | Iraq | 32.0 |
| 62 | Bhutan | 32.0 |
| 63 | Nepal | 31.9 |
| 64 | Tajikistan | 31.9 |
| 65 | Moldova | 31.6 |
| 66 | Lebanon | 31.5 |
| 67 | Trinidad and Tobago | 31.3 |
| 68 | Botswana | 31.2 |
| 69 | Mozambique | 31.2 |
| 70 | Maldives | 31.0 |
| 71 | Tunisia | 30.7 |
| 72 | Egypt | 30.1 |
| 73 | United Arab Emirates | 30.1 |
| 74 | Morocco | 29.8 |
| 75 | Qatar | 29.6 |
| 76 | Jamaica | 29.4 |
| 77 | Albania | 29.3 |
| 78 | Niger | 29.2 |
| 79 | Malawi | 29.1 |
| 80 | Kosovo | 29.0 |
| 81 | Vietnam | 28.8 |
| 82 | Mongolia | 28.7 |
| 83 | Zambia | 27.4 |
| 84 | Nicaragua | 27.3 |
| 85 | Mauritania | 27.1 |
| 86 | Eritrea | 27.1 |
| 87 | Afghanistan | 27.0 |
| 88 | Rwanda | 26.7 |
| 89 | India | 26.1 |
| 90 | Mexico | 25.7 |
| 91 | Uzbekistan | 25.7 |
| 92 | Kenya | 25.5 |
| 93 | Ireland | 25.3 |
| 94 | Mauritius | 24.8 |
| 95 | Togo | 24.7 |
| 96 | Cambodia | 24.6 |
| 97 | Puerto Rico | 24.3 |
| 98 | Côte d’Ivoire | 23.8 |
| 99 | Armenia | 23.5 |
| 100 | Malaysia | 22.7 |
| 101 | Congo, Republic of | 22.6 |
| 102 | Papua New Guinea | 22.4 |
| 103 | Burundi | 22.3 |
| 104 | Senegal | 22.2 |
| 105 | Philippines | 21.8 |
| 106 | Panama | 21.7 |
| 107 | Gambia | 21.6 |
| 108 | Pakistan | 21.6 |
| 109 | Thailand | 21.6 |
| 110 | Sierra Leone | 21.5 |
| 111 | Ghana | 21.5 |
| 112 | Peru | 21.4 |
| 113 | Myanmar | 20.4 |
| 114 | Uganda | 20.1 |
| 115 | Laos | 19.9 |
| 116 | Angola | 19.7 |
| 117 | Costa Rica | 19.7 |
| 118 | Kazakhstan | 19.5 |
| 119 | Haiti | 19.3 |
| 120 | Paraguay | 19.0 |
| 121 | Sri Lanka | 18.6 |
| 122 | Cameroon | 18.5 |
| 123 | Iran | 18.2 |
| 124 | Taiwan | 17.9 |
| 125 | Zimbabwe | 17.5 |
| 126 | Indonesia | 16.6 |
| 127 | Tanzania | 16.5 |
| 128 | Comoros | 16.4 |
| 129 | Madagascar | 16.3 |
| 130 | Central African Republic | 16.3 |
| 131 | Ethiopia | 16.1 |
| 132 | Guinea | 15.7 |
| 133 | Sudan | 15.1 |
| 134 | Singapore | 14.6 |
| 135 | Bangladesh | 14.3 |
| 136 | Turkmenistan | 13.7 |
| 137 | Chad | 13.3 |
| 138 | Nigeria | 13.0 |
| 139 | Guatemala | 12.3 |
| 140 | Yemen | 12.1 |
| 141 | Congo, Democratic Republic of | 11.2 |
Some smaller countries excluded.
Related
Sir, there is no India in this list. what would be its position
India government spending is 26.1% of GDP
Sir, I cannot find Brazil in this list. No data avilable, is that it?