
This is a collection of diagrams for supply and demand. It is mainly for my benefit, so when creating a post, like the price of tea (or when I’m teaching online) I can easily find a suitable diagram to illustrate what is happening.
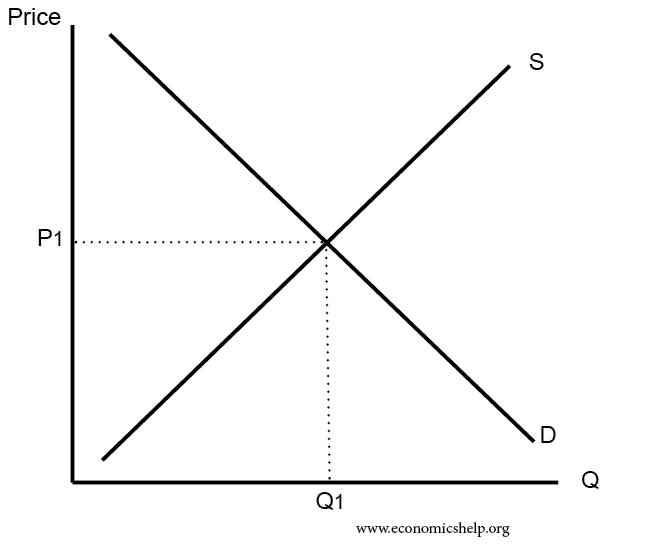
Demand curve
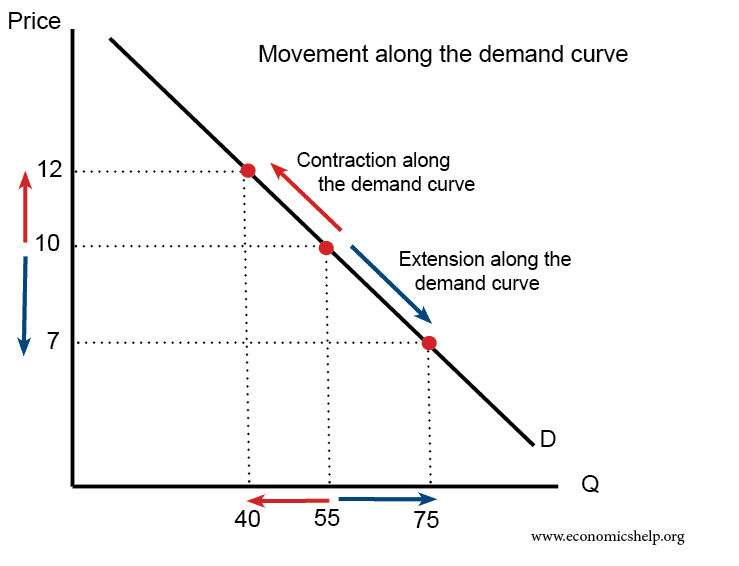 A contraction on the demand curve is due to higher price leading to lower demand
- An extension on the demand curve is due to lower price leading to higher demand.
The supply curve
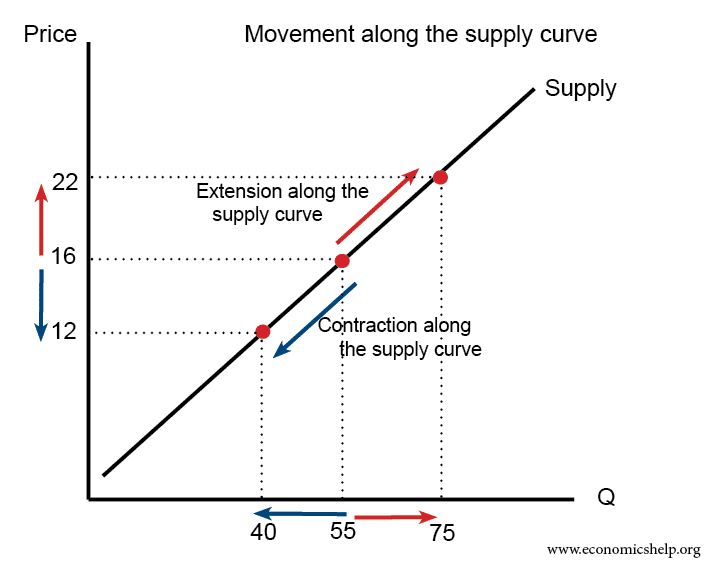
- A higher price causes an extension along the supply curve (more is supplied)
- A lower price causes a contraction along the supply curve (less is supplied)
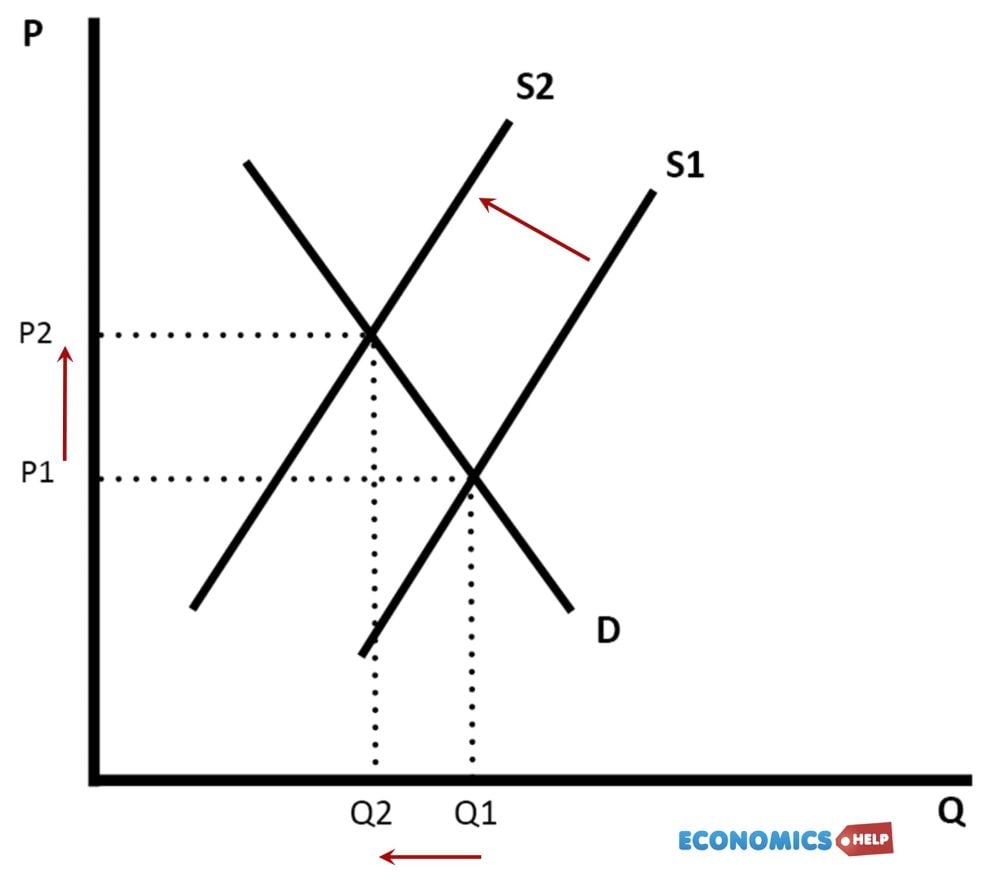
Supply Shifts to the left
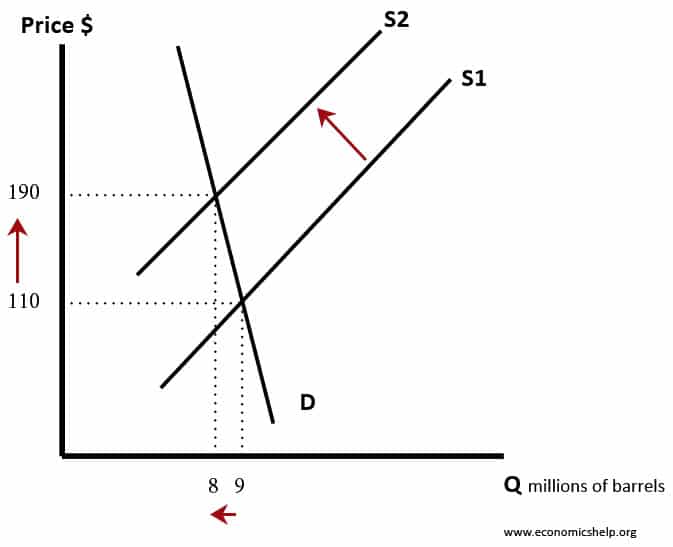
In this diagram the supply curve shifts to the left. It leads to a higher price and fall in quantity demand. The supply curve may shift to the left because of:
- Higher costs of production
- Higher taxes
- Fall in productivity
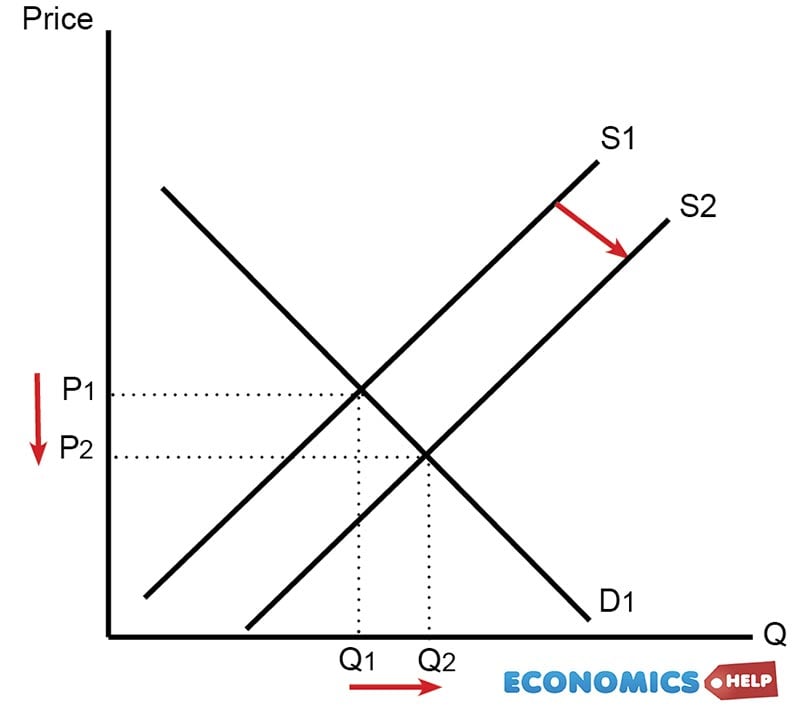
Supply curve shifts to the right.
Supply and Demand Shift Right
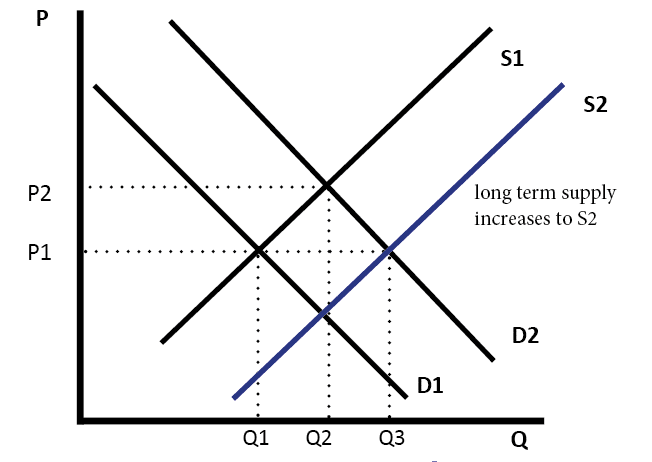
In this diagram, supply and demand have shifted to the right. This has led an increase in quantity (Q1 to Q2) but price has stayed the same.
It is possible, that if there is an increase in demand (D1 to D2) this encourages firms to produce more and so supply increases as well.
Diagram showing Increase in Price
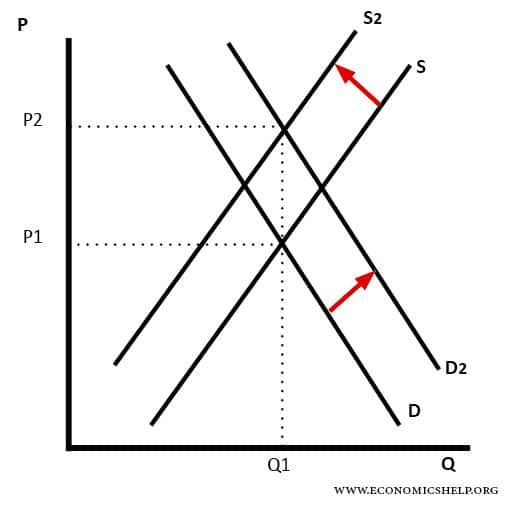
In this diagram, we have rising demand (D1 to D2) but also a fall in supply. The effect is to cause a large rise in price.
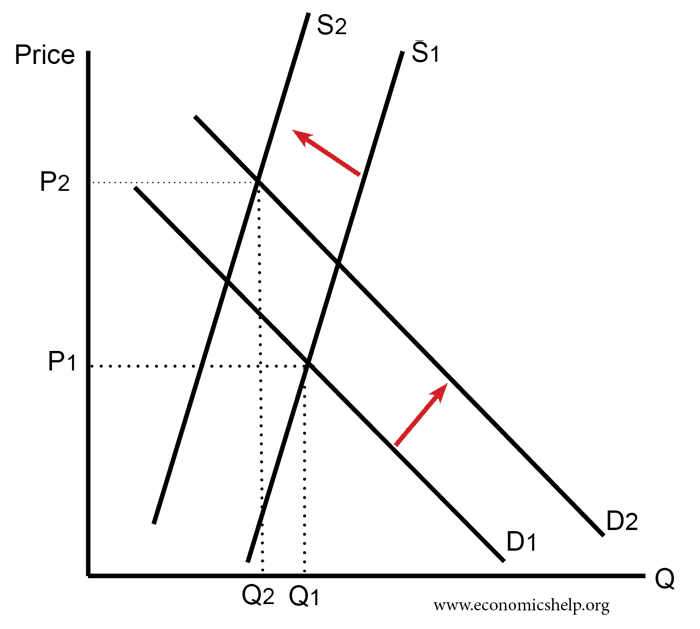
For example, if we run out of oil, supply will fall. However, economic growth means demand continues to rise.
Increase in Demand
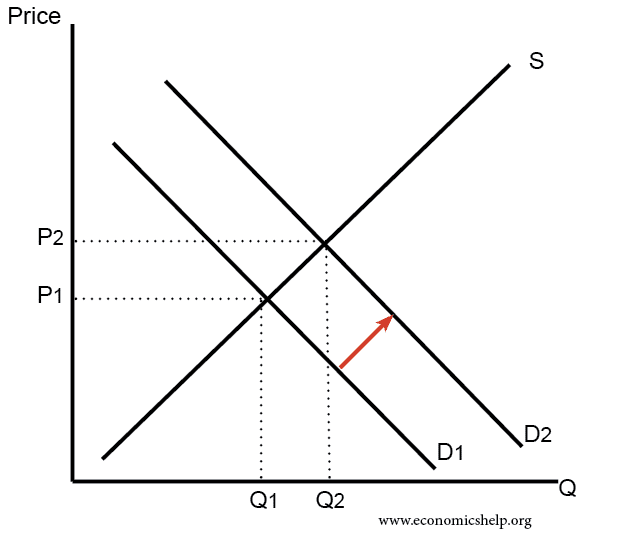
An increase in demand leads to higher price and higher quantity.
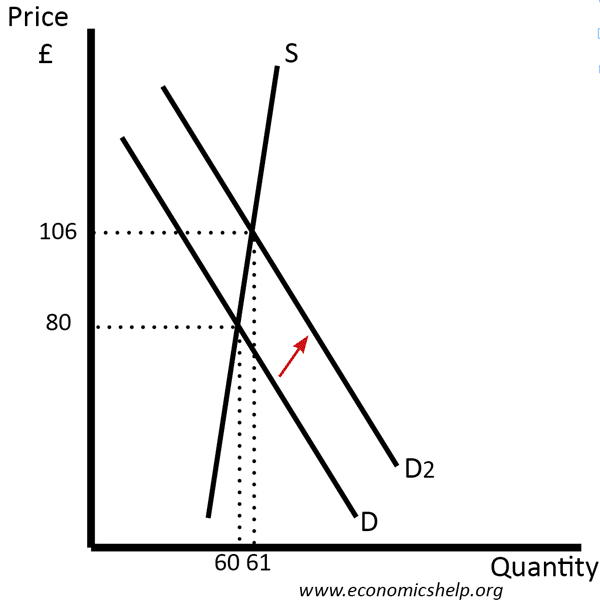
Increase in demand with inelastic supply
A Fall in Demand
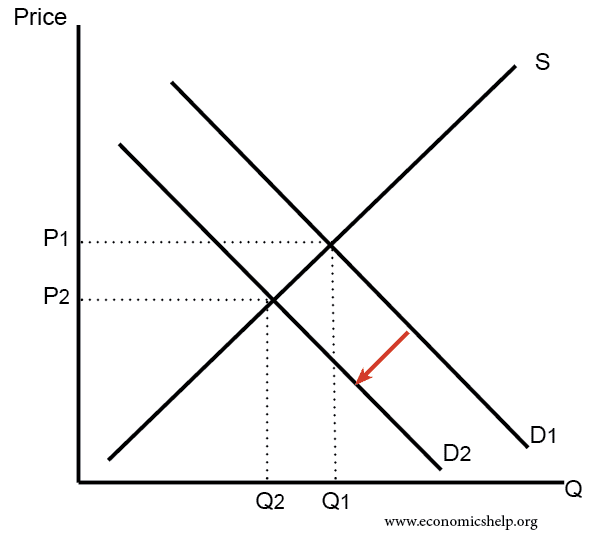
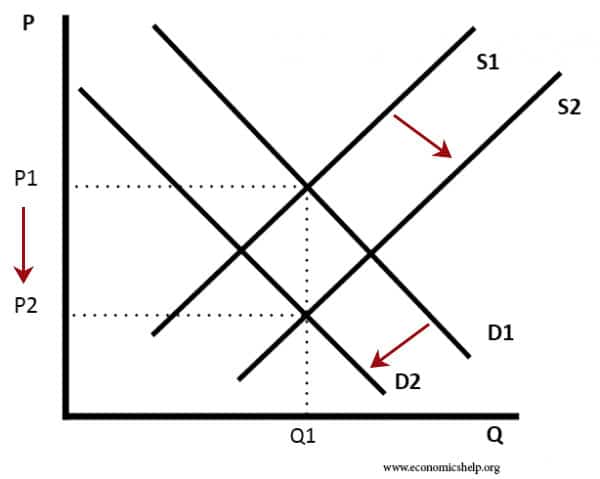
Fall in demand increase supply
Fall in Supply
Fall in supply causing lower quantity and higher price.
Increase in supply – inelastic demand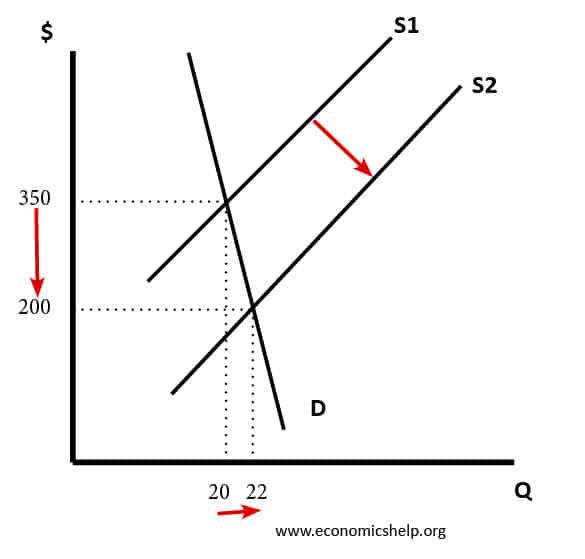 An increase in supply when demand is inelastic only causes a small rise in demand.
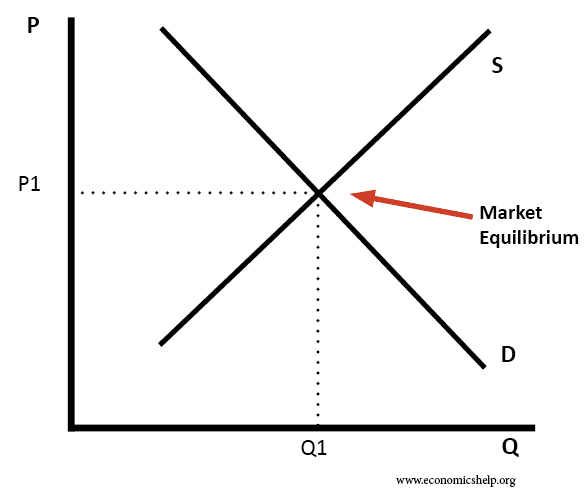
Market equilibrium
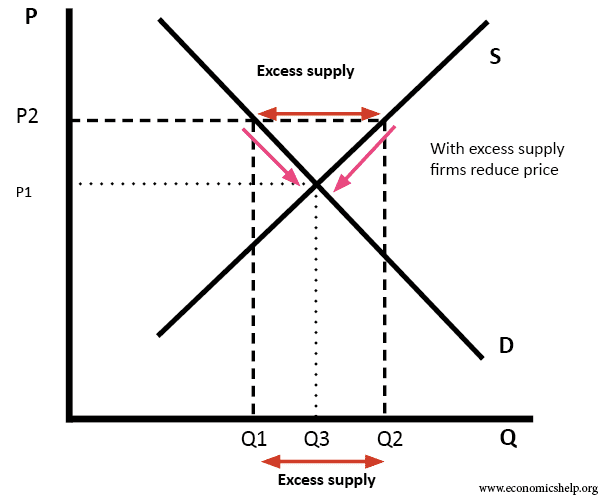
 Excess supply involves price above the equilibrium
Excess demand
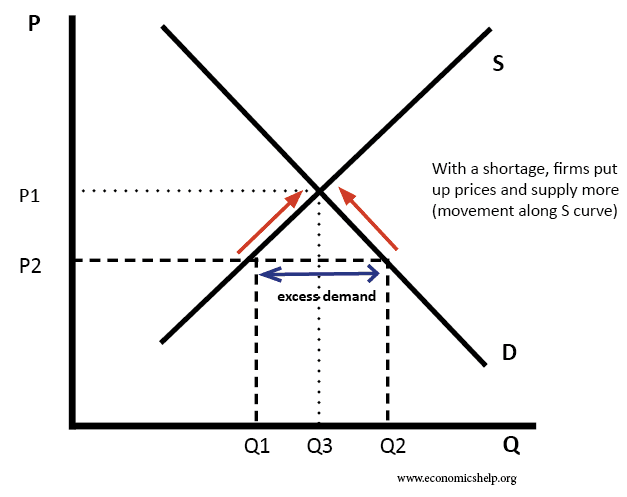
Increase in demand
Rise in demand and rise in supplt
Increase in demand causes supply to increase in long term.
Price set below the equilibrium (football)
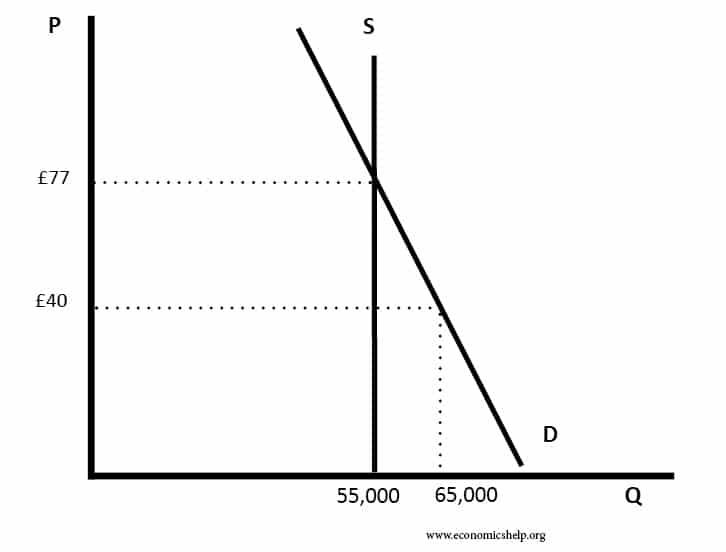
Inelastic supply and bigger increase in demand
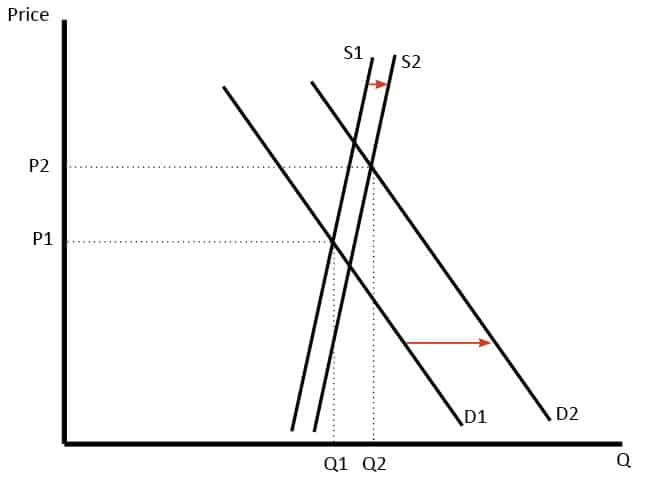
UK Housing market has often seen demand increase at a faster rate than supply, causing price to rise.
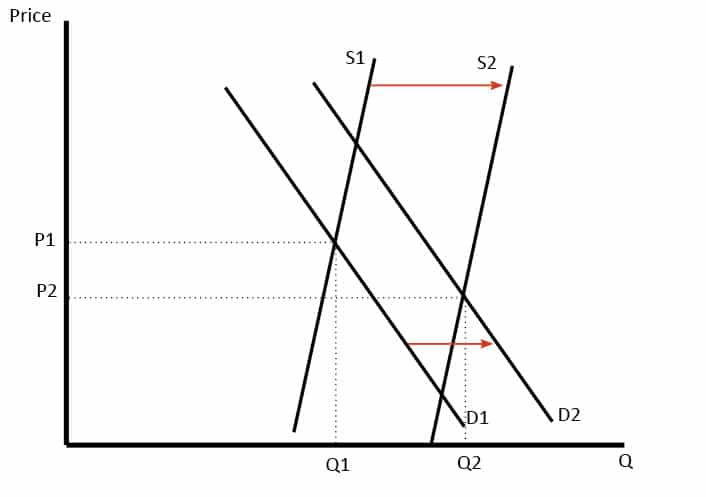
Supply increase same as demand.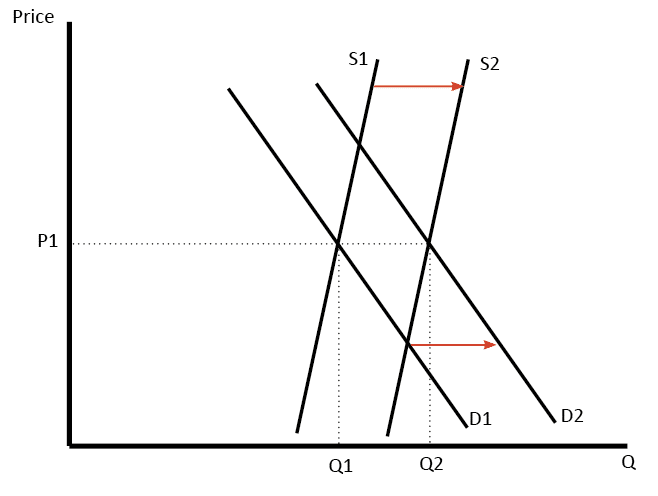
Fall in supply, stimulating rise in supply next year
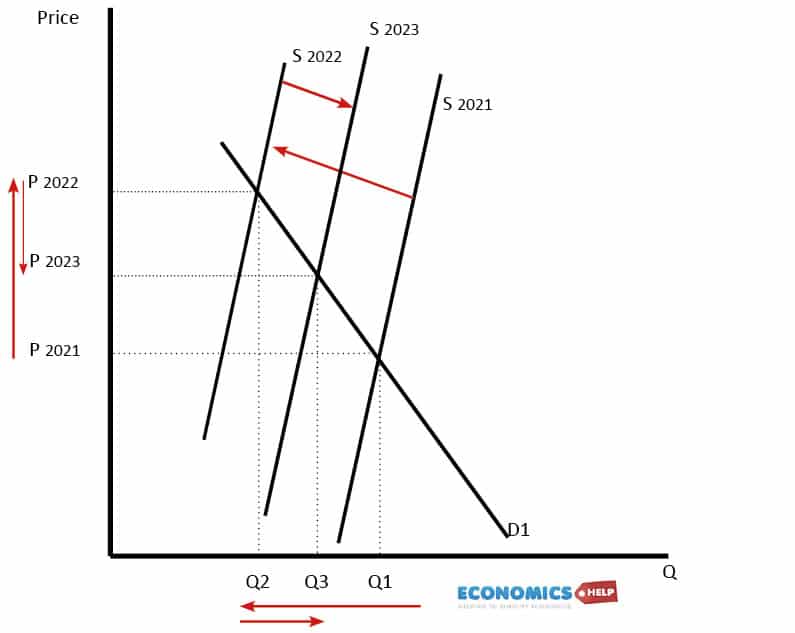
This represents market for wheat. A fall in supply in 2022, leads to sharp rise in price, but it encourages farmers to plant more for the next year, so supply should recover in 2023.
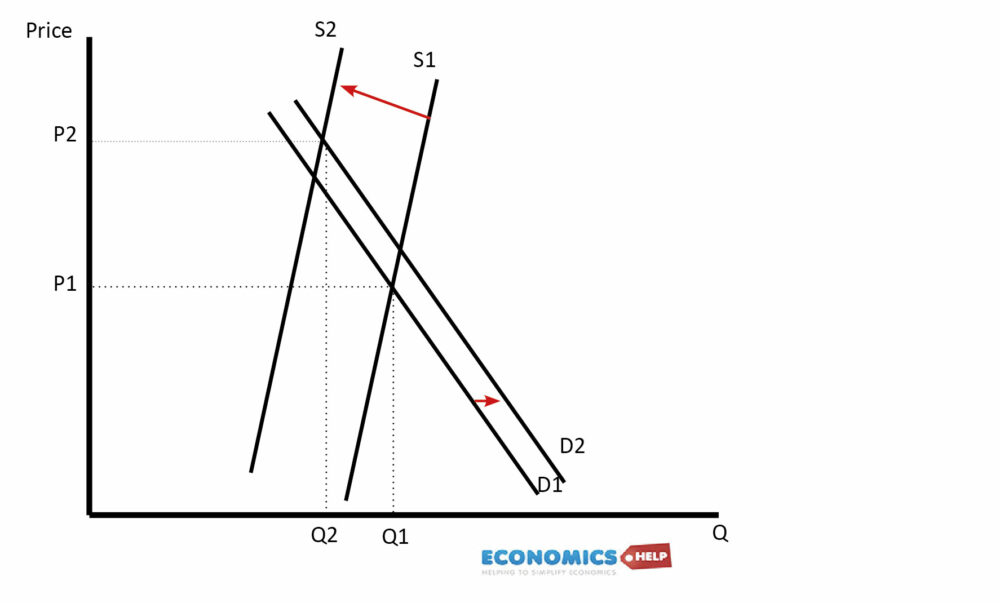
Higher price of wheat caused by fall in supply and rise in demand.
Elasticity
The effect of a subsidy depends on the elasticity of demand
 The effect of a tax depends on elasticity of demand
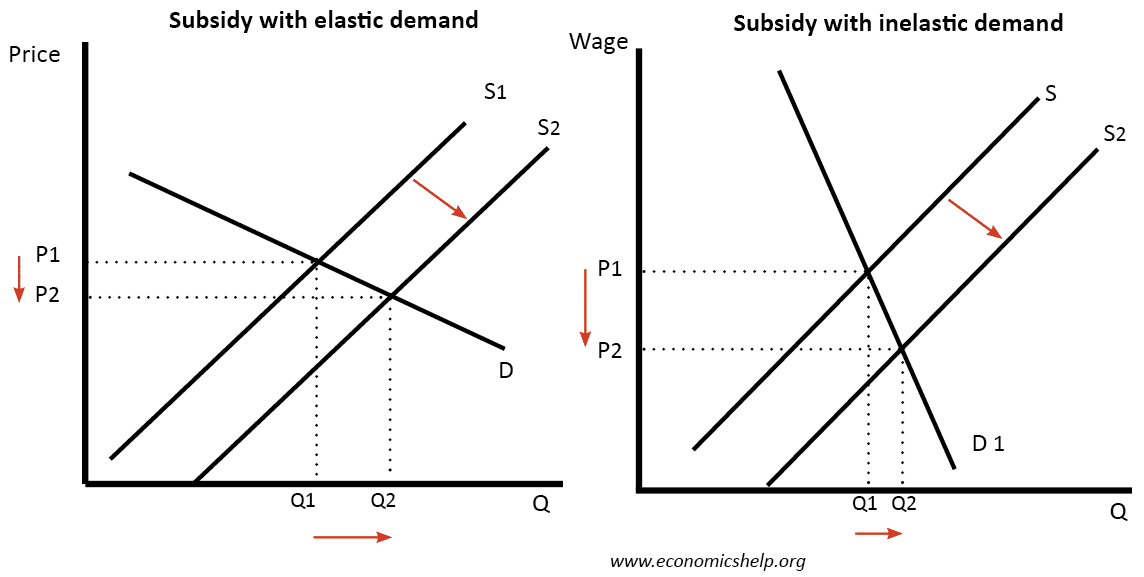 The effect of a tax depends on elasticity of demand
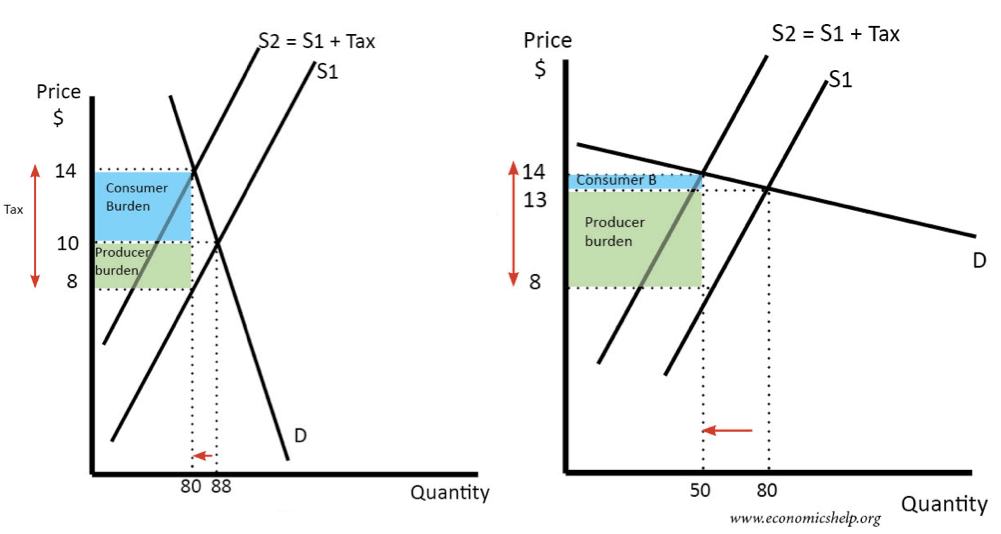
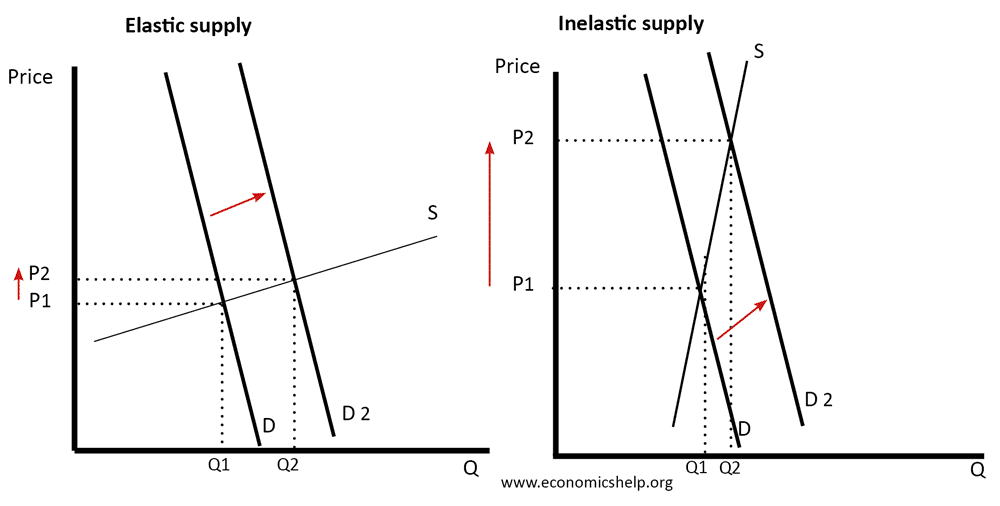
The effect of rise in demand depends on elasticity of supply
Related
About The Author

this is too confusing and there should be more of can explanation
Thanks alot 🤩 you helped alot
How to address this question?: Suppose the price of platinum were to rise. Using a diagram, explain how the change in the price this commodity would affect the rand-dollar exchange rate, ceteris paribus.
Do you know the fourth law and fifth of demand and supply the aid of diagram for each
Thank you very very much. I’m from pakistan and I’m now doing CMA in Pakistan this websites is very helpful for all levels of students. I say again to you thank you very much