In the post-war period, there was a dramatic decline in income inequality in the UK. However, from the early 1980s, this went into reverse with a sharp rise during the Thatcher years.
The UK has now one of the highest levels of inequality in the developed world and in recent years the UK has also experienced growing inequality in terms of wealth, geography, and even age. We will look at why this is occurring, why it is a problem and what if anything can be done.
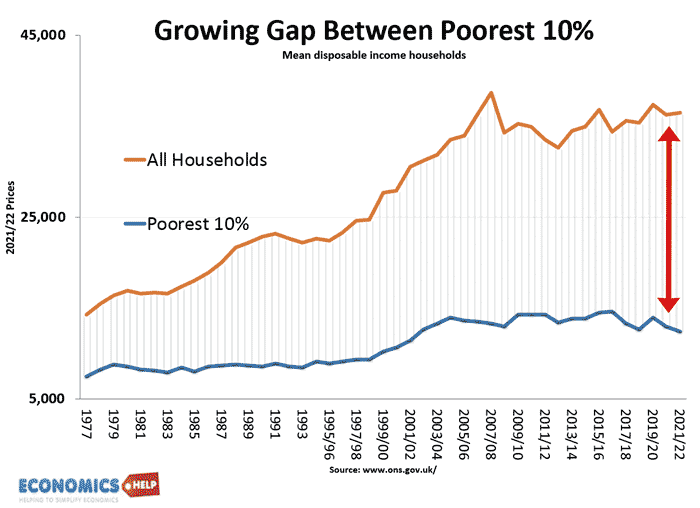
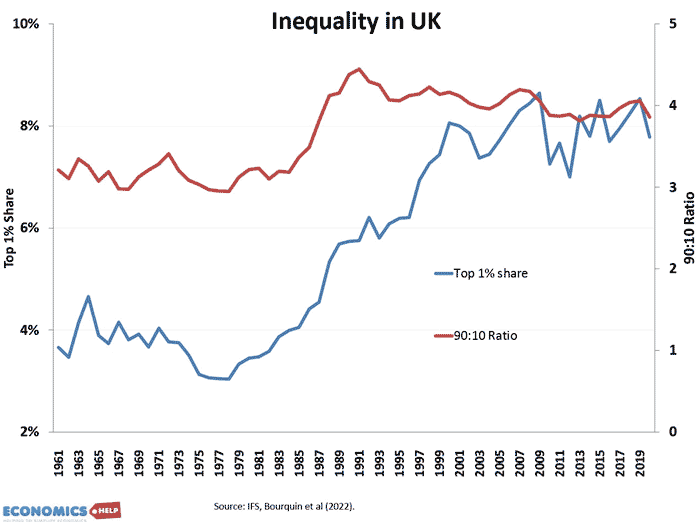
Since 2007, we can see a growing gap between average households and the poorest 10%. An inequality that is magnified by a decline in the real income of the poorest 10%. When household income is £15,000 a 13% drop is nearly impossible to deal with. Whilst the poorest see falling incomes, the biggest growth in incomes is from the top 1%. It is the top 1% of earners who have done the best since the financial crisis.
This shows a clear rise in child and adult poverty, whilst pensioner poverty has almost halved. What explains this? A significant cause was the austerity of the 2010s which contributed to low productivity, low economic growth and real cuts in benefits, and falling real pay, especially for unskilled and public sector workers. The improvement in pension poverty reflects relatively more generous pension benefits, but there has not been the same political willingness to protect real pay or working age benefits.
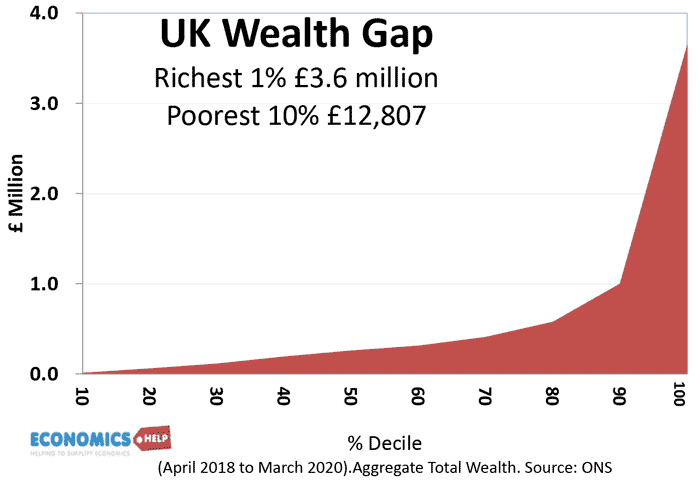
However, income disparity is only part of the issue. For young people, the high cost of living and housing is a double whammy effect. The UK wealth gap is even more extreme, with the richest 1% owning wealth of £3.6 million, compared to the poorest 10% having wealth of just £12,000.
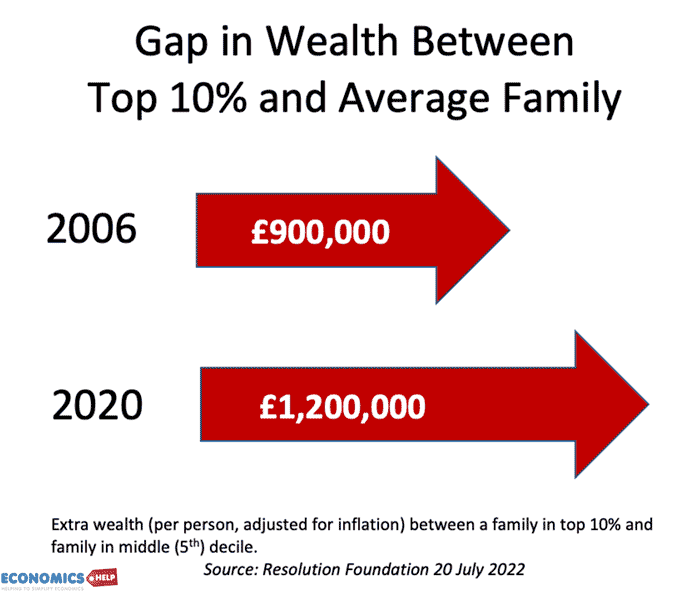
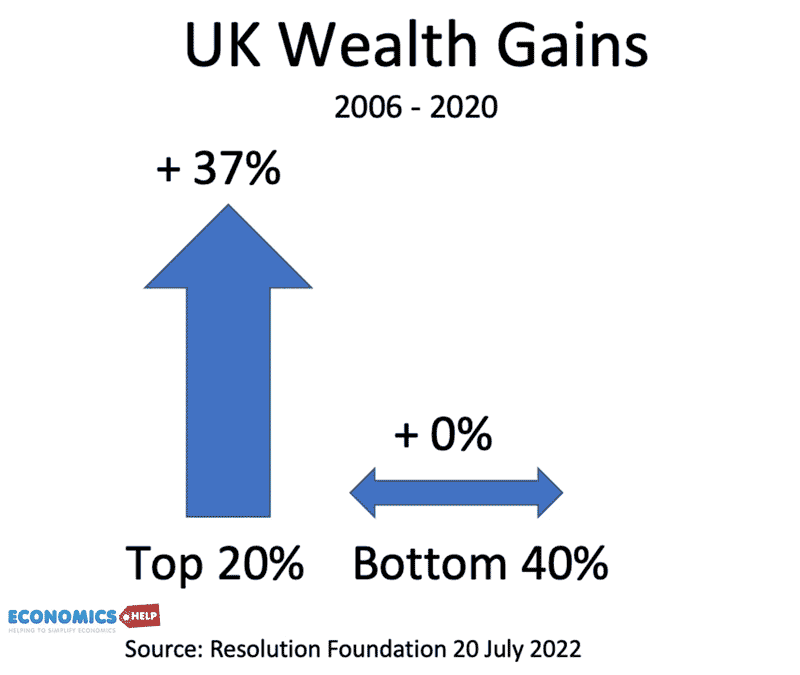
Soaring house prices have created a passive surge in wealth for homeowners. The gap in wealth between the top 10% and average family has increased from £900,000 in 2006 to £1,200,000 in 2020. This is partly due to ever-rising house prices, pushing prices to record income multiples. The broken housing market, with severe shortages, is exacerbating inequality between property owners and renters. Since 2006, the top 20% have seen their wealth rise 37%. Whilst the bottom 40% have seen no change.
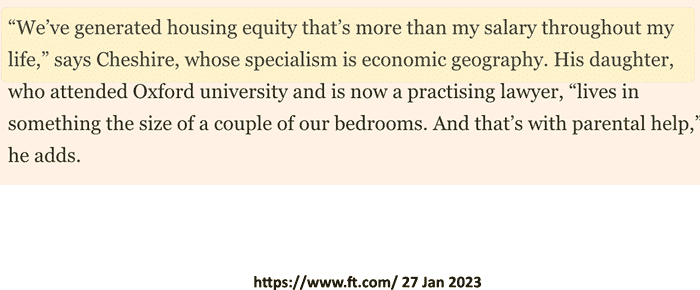
In a recent FT article, a professor at LSE admitted he gained more through wealth gained by rising house prices than he ever earnt from his salary.
The rise in house prices is also causing an intergenerational divide, with homeownership increasingly the preserve of the older generation or those lucky enough to inherit from the bank of mum and dad. The ratio of wealth owned by the over 65s has risen from 42% in 2006 to 51% in 2019 – just 13 years later. Though when discussing pensioners it is also important to bear in mind, there is wide inequality among the over 65s themselves.
But, a key shift has definitely occurred – for the first time in living memory, the younger generation face lower living standards than their parents. It is not just unaffordable housing, but student loans, transport and higher tax. Graduates are facing a marginal tax rate of over 50%, making it even harder to save for deposits, which have outstripped wages.
The problem is not just inequality. The cost of living makes labour markets more inflexible, forces people to move out of London, contributes to labour shortages and affects economic growth. In the past decades, the UK has become better at growing wealth rather than income.
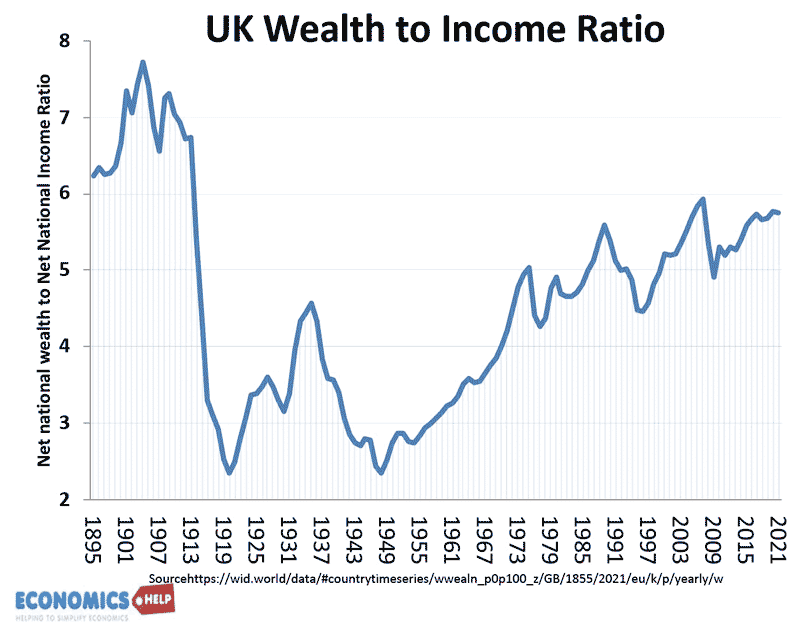
Since 1949, the ratio of wealth to income has soared. But, increased wealth is not spurring economic growth – whilst house prices have soared, productivity and economic growth has flatlined. Such levels of inequality also threaten social cohesion, with many feeling left behind, unable to afford a decent living standard, even with supposedly well-paying jobs.
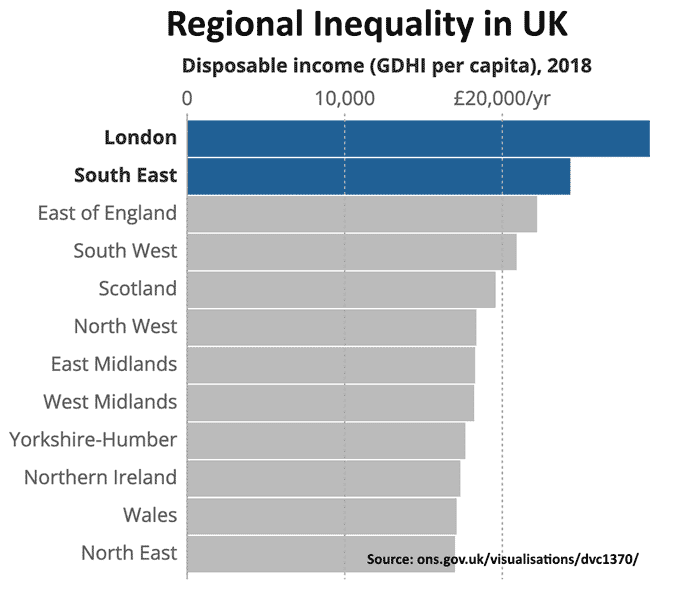
But, as the Brexit debate revealed, the UK has another layer of inequality – by region. A report by Eurostat claimed the UK had the richest region in northern Europe (London) but also the 9 out of the 10 poorest regions. This is now a bit dated and you could argue with the methodology, but whether this is strictly true, it is clear the UK has one of the highest levels of regional inequality in the developed world. Disposable income is more than 50% higher in London than the northeast.
Using gross value added gives a similar result. Yet, it is London’s wealth which has attracted most of the infrastructure investment, leaving northern regions outside Manchester struggling to attract peanuts. The government’s much-vaunted levelling up schemes are struggling to be more than a drop in the ocean.
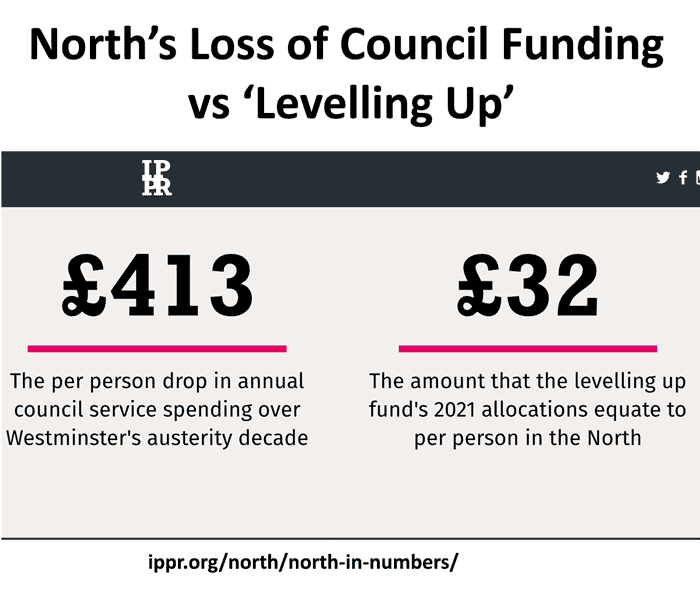
The IPPR report a decline of £413 per capita council funding will be replaced by just £32 levelling up funds.
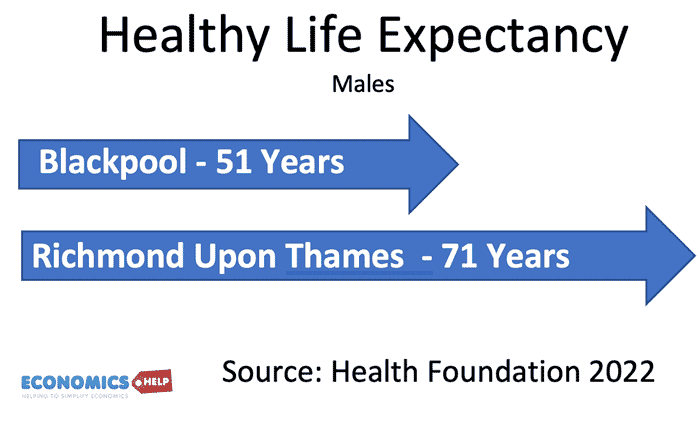
This regional inequality is also reflected in the quality of life, here, we can see a variation in male healthy life expectancy of 51 years in Blackpool and 71 years in Richmond Upon Thames. This healthy life expectancy raises issue of raising the retirement age.
Now some of these trends in inequality are global and reflected in other countries – highlighted in work by Thomas Picketty. In the US, there has been increased concentration of wealth in the top 1%. Jobs and wealth increasingly benefit metropolitan cities, with rural and former industrial basis being left behind. The world is seeing rapid development in technology, which is changing economic patterns, but the proceeds of technology and globalisation are not being equally shared. There is no easy solution. The UK does have a reasonably progressive income tax system, but wealth goes largely untaxed. The minimum wage has been of great help, but can only do so much
Other solutions need to involve increasing the supply of affordable homes, Global tax cooperation to prevent tax avoidance, It also requires Meaningful investment in deprived regions with the devolution of decision-making. And a topic I will look at in the future a Universal basic income from proceeds of tech and energy monopolies. The whole issue of inequality is also more problematic because of the UK’s relative economic decline, which you can learn more about here.
