How many migrants have come to the UK in recent years?
Between 1991 and 2021, the ONS estimate
- 14.64 million immigration
- 10.36 million emigration
- 5.55 – Net Migration (average of 177,000)
Between 2002 and 2021 (last 20 years)
- 12.0 million immigration
- 7.2 million emigration
- 4.64 net migration (average of 232,000)
Between 2012 and 2021 (last 10 years)
- 6.7 million immigration
- 3.6 million emigration
- 2.56 net migration (average of 256,000)
Latest data Year ending 2022
- Net migration was 504,000 (Partly due to Covid rebound)
Net migration 2020-22
ONS produce another recent statistic (International Migration Data)
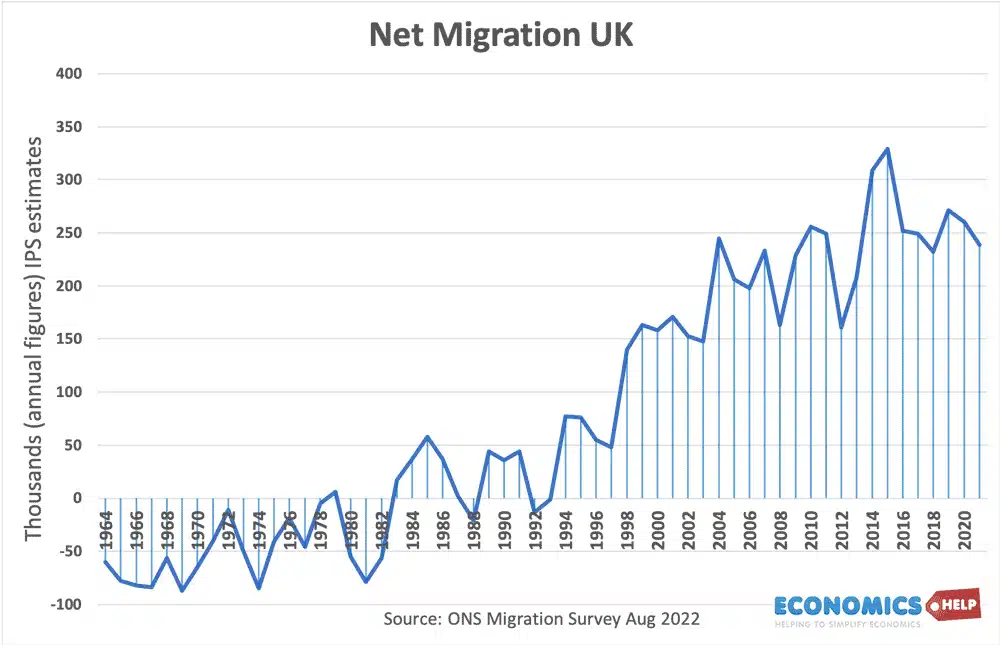
This shows net migration for the year ending June 2022, was 504,000 – the highest level on record. Of this, it was almost entirely due to non-EU migration. With EU net migration negative, falling 51,000.
Caveat, this partly reflects Covid, where the usual migration flows stopped. So 2022, saw a rebound that is not expected to continue.
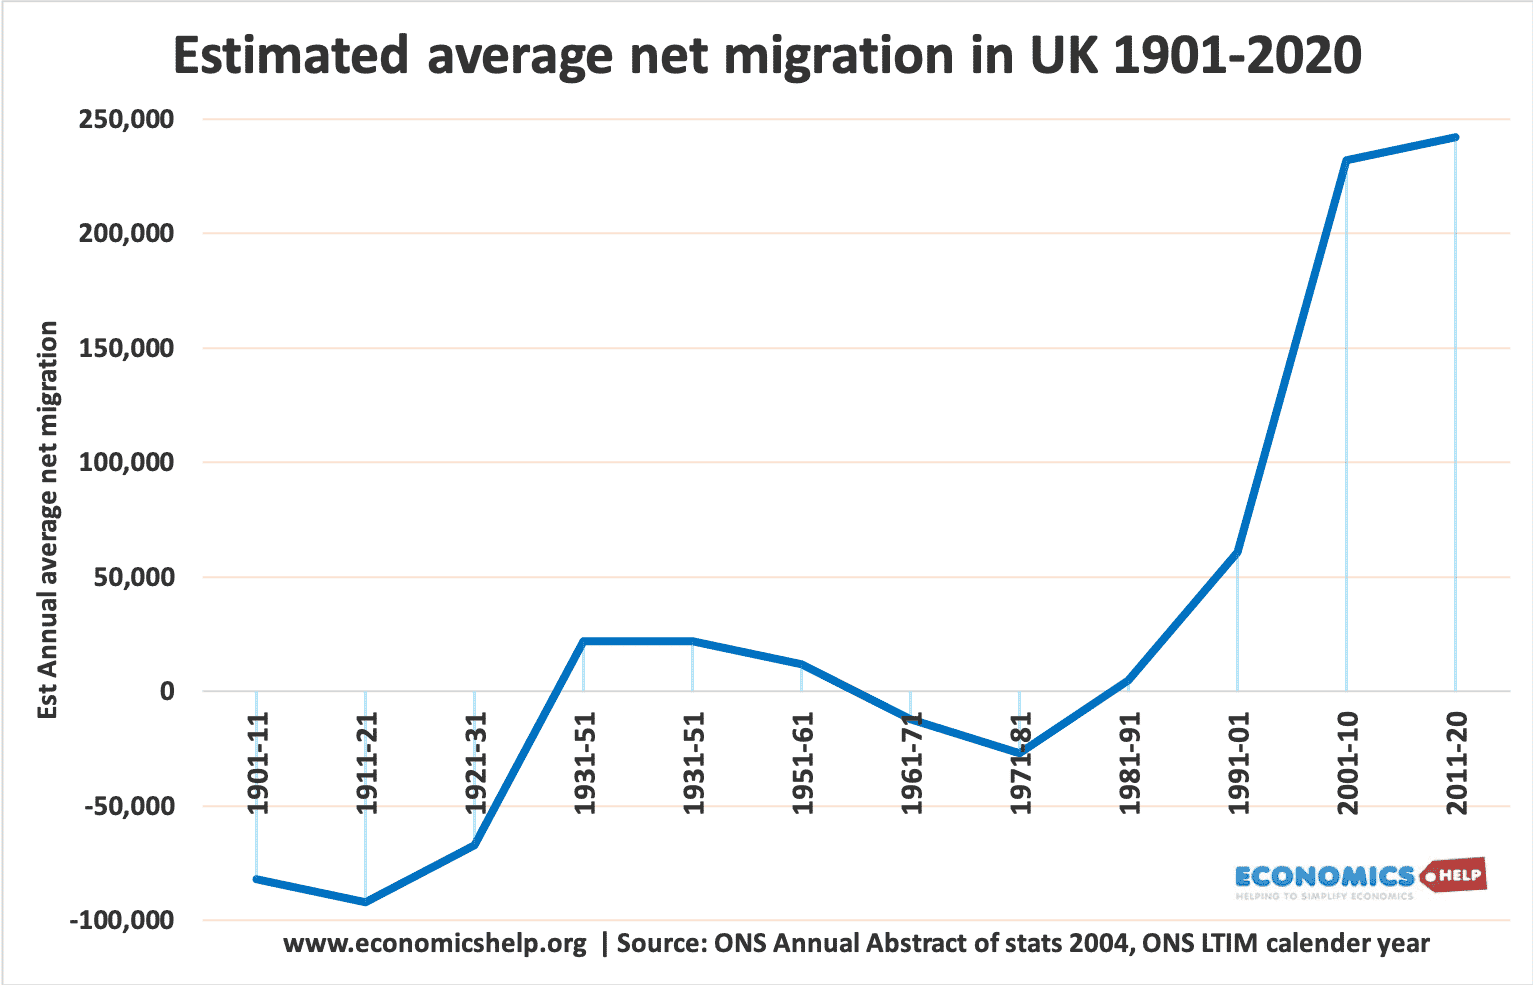
Historical Net Migration levels since 1901
Until the 1990s, UK net migration was fairly low. IN the first half of the twentieth century, net migration was negative
Migration and growth in real income
Reasons for migration
Data From ONS Tables
Further reading