A key test in understanding economics is being able to interpret data. If you really want you can present data in a way which supports your argument. Therefore, always be careful about how you look at data.
This is an example of how you could view employment statistics in the US.
Total employment
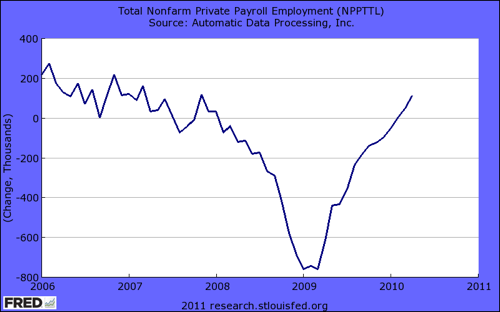
This graph shows the steep fall in employment, with a barely noticeable uptick in employment at the start of 2010

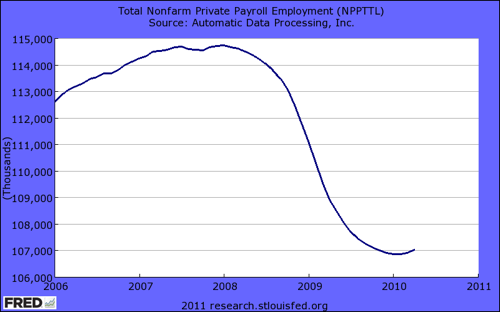
The second graph looks much more promising because it looks like the employment situation has changed for the better. But, the important thing to realise is that in 2009, employment is still falling. (employment is just falling at a slower rate) Only at the start of 2010, is there finally an increase in employment.
However, even if a graph shows growth in employment it may still give a misleading sign to the state of the economy. If you have very small employment growth, when the unemployment rate is 15%, this is hardly cause for celebration. The growth in employment is insufficient to solve the unemployment problem.
Clearly these statistics have important considerations for policy. Looking at the first graph may justify fiscal and monetary stimulus.
Two Ways of Looking at Job Market – Thinkprogress
The second graph may give a sense of complacency that the employment situation has turned around.
GDP, Economic Growth and the Output Gap
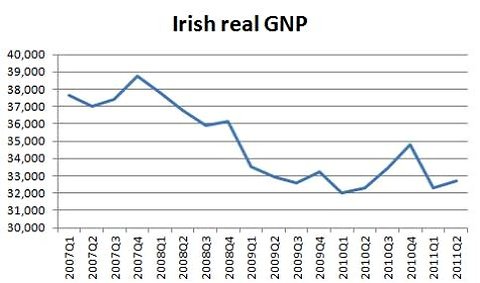
Another issue is to look at a country like Ireland or Latvia and to see how they now have positive economic growth and conclude that this is proof that austerity and internal devaluation work!
But, Latvia and Ireland have experienced a small recovery in economic growth after a much bigger fall in GDP. Therefore, although the economy has recovered a little, it is still much worse than before their crisis.
Also, if you have an economy like the UK, we may have a long run trend rate of economic growth of about 2.5%. If we experience negative growth of 2%. Then the negative output gap increases to about 4%. Therefore, even if we get growth of 2%, it is still not enough to bridge the negative output gap.
Related


another thing is dont put to much into one or two reports; “the confidence interval for the monthly change in…employment from the establishment survey is on the order of plus or minus 100,000”