Definition: Gross fixed capital formation is essentially net investment. It is a component of the Expenditure method of calculating GDP.
To be more precise Gross fixed capital formation measures the net increase in fixed capital.
Gross fixed capital formation includes spending on land improvements, (fences, ditches, drains, and so on) plant, machinery, and equipment purchases; the construction of roads, railways, private residential dwellings, and commercial and industrial buildings. Disposal of fixed assets is taken away from the total.
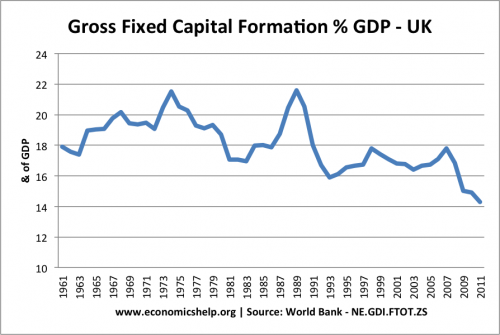
The fall in Gross Fixed capital formation has been a significant contributor to the recent UK recession. (contributions to UK growth)
Total Gross Fixed Capital Formation US
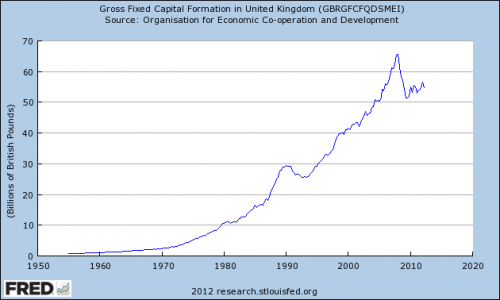
source: St Louis Fed
Investment is usually highly cyclical. (See: accelerator effect) The recessions of 1991 and 2008 saw a sharp fall in gross fixed capital formation. This is because if output falls, firms expect to make lower profits. Therefore they start to think of cutting back output rather than increase it.
International Comparisons of Gross Fixed Capital Formation
Generally speaking, developing countries often devote a higher % of GDP to investment. Countries with rapid rates of economic growth are heavily investing in more fixed assets to enable rapid economic growth. China has one of the highest rates of gross fixed capital formation.
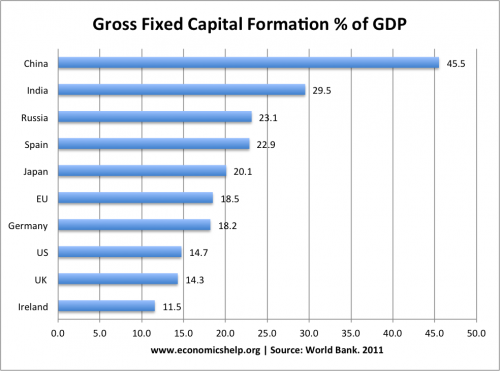
China’s high rate of economic growth has been spurred by devoting a significant per cent of resources to investment. Investment increases both aggregate demand, but also increases future productive capacity.
The UK and US economy are more geared towards consumption spending.
The global average for gross fixed capital formation is 20%
Some of the poorest countries cannot afford investment, and so concentrate on current consumption. For example, at the height of the Zimbabwe crisis in 2008, investment fell to less than 3% of GDP.
Irish Investment
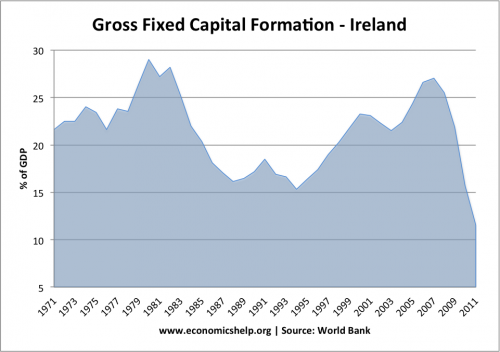
Irish investment is a mirror of their economic performance. After recovering from an economic slowdown in the 1980s, the boom years saw rapid growth in investment. peaking at over 26% of GDP. However, with the onset of the credit crunch, investment has fallen to just 11% of GDP.
More on Definitions of Gross Fixed Capital Formation
Gross Fixed Capital Formation excludes
- Land Purchases
- Effects of depreciation (referred to as consumption of capital)
The OECD defines it as:
“Gross fixed capital formation as defined by the European System of Accounts (ESA) consists of resident producers’ acquisitions, fewer disposals, of fixed assets during a given period plus certain additions to the value of non-produced assets realised by the productive activity of producer or institutional units. (OECD)
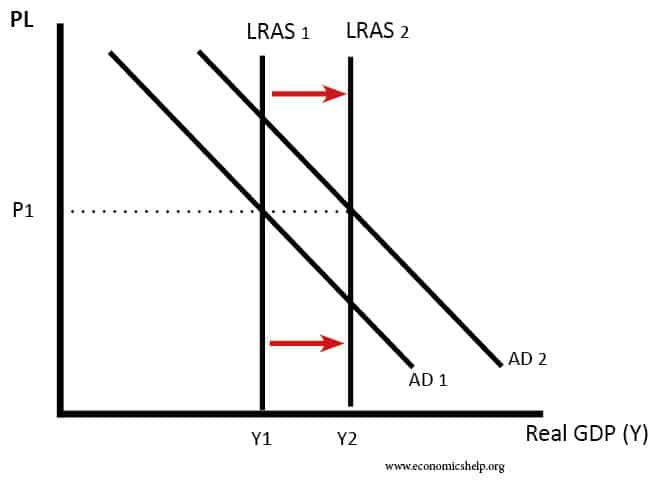
Macroeconomic impact of an increase in gross fixed capital formation
In macro theory, a rise in investment should contribute towards higher aggregate demand (AD) and also increase productive capacity (LRAS). Increasing investment should lead to higher economic growth in the long-term (though it depends on how effective the investment is.
Opportunity cost of investment
The opportunity cost of gross fixed capital investment is lower consumption – at least in the short-term. If more resources are spent on capital goods, it leads to a decline in consumption of consumer goods.
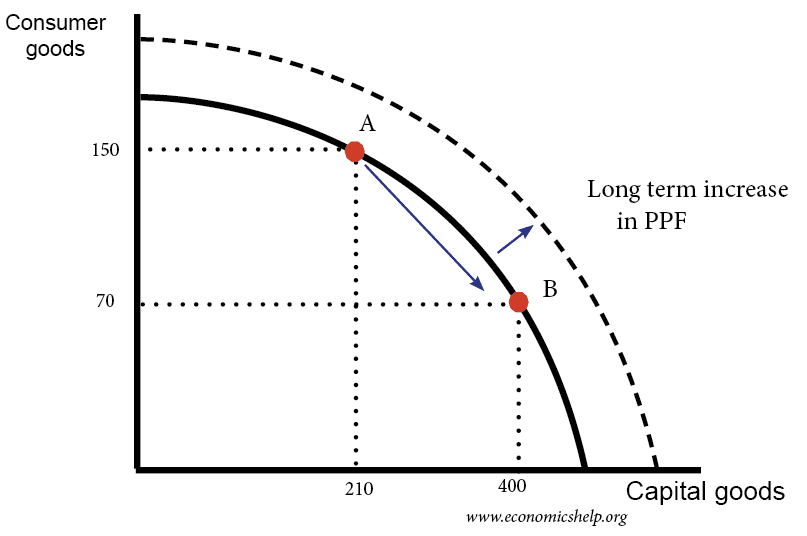
With an economy operating on the PPF (no unemployment) an increase in capital consumption leads to move from A to B. But, in the long-term, the investment can enable greater productive capacity and PPF curve shifts to the right.
List of Countries Gross Fixed Capital Formation by % of GDP
| Turkmenistan | 60 |
| Mongolia | 48.6 |
| China | 45.5 |
| East Asia & Pacific (developing only) | 40.7 |
| Belarus | 37.6 |
| Cape Verde | 36.5 |
| Lesotho | 34.9 |
| Sri Lanka | 34.6 |
| Liberia | 33.3 |
| Indonesia | 32.4 |
| Romania | 32.2 |
| Vietnam | 31.9 |
| Kosovo | 31.2 |
| Armenia | 30.9 |
| Senegal | 30.7 |
| Morocco | 30.6 |
| Lebanon | 30.0 |
| Nicaragua | 29.7 |
| India | 29.5 |
| Upper middle income | 28.1 |
| Tanzania | 28.1 |
| Botswana | 27.9 |
| Middle income | 27.6 |
| Panama | 27.5 |
| Low & middle income | 27.5 |
| Lao PDR | 27.4 |
| Benin | 27.4 |
| South Asia | 27.3 |
| Australia | 27.1 |
| Namibia | 26.5 |
| Bahamas, The | 26.0 |
| Mauritania | 25.9 |
| Thailand | 25.8 |
| Lower middle income | 25.6 |
| Other small states | 25.4 |
| Serbia | 25.3 |
| Gabon | 25.1 |
| Albania | 24.9 |
| Kyrgyz Republic | 24.8 |
| Bangladesh | 24.7 |
| Sudan | 24.7 |
| Mauritius | 24.4 |
| Uganda | 24.4 |
| Mozambique | 24.3 |
| Kenya | 24.3 |
| Ecuador | 24.2 |
| Tunisia | 24.0 |
| Czech Republic | 23.9 |
| Moldova | 23.9 |
| Kazakhstan | 23.9 |
| Peru | 23.8 |
| Uzbekistan | 23.5 |
| Congo, Rep. | 23.4 |
| Singapore | 23.4 |
| Bulgaria | 23.3 |
| Chile | 23.2 |
| Russian Federation | 23.1 |
| Jamaica | 22.9 |
| Europe & Central Asia (developing only) | 22.8 |
| Argentina | 22.6 |
| Slovak Republic | 22.4 |
| Latvia | 22.4 |
| Honduras | 22.2 |
| Montenegro | 22.1 |
| Croatia | 21.9 |
| Colombia | 21.9 |
| Ghana | 21.8 |
| Spain | 21.7 |
| Macedonia, FYR | 21.5 |
| Estonia | 21.5 |
| Paraguay | 21.3 |
| Jordan | 21.3 |
| Zambia | 21.3 |
| Nepal | 21.2 |
| Austria | 21.1 |
| Belgium | 20.9 |
| Malawi | 20.8 |
| Bosnia and Herzegovina | 20.7 |
| Sub-Saharan Africa (all income levels) | 20.4 |
| Sub-Saharan Africa (developing only) | 20.4 |
| Latin America & Caribbean (all income levels) | 20.4 |
| Mexico | 20.4 |
| Latin America & Caribbean (developing only) | 20.4 |
| Norway | 20.2 |
| France | 20.1 |
| Turkey | 20.0 |
| Costa Rica | 19.8 |
| Italy | 19.5 |
| Slovenia | 19.5 |
| Egypt, Arab Rep. | 19.4 |
| Togo | 19.4 |
| Euro area | 19.3 |
| Brazil | 19.3 |
| Ukraine | 19.3 |
| Finland | 19.2 |
| Saudi Arabia | 19.0 |
| Ethiopia | 19.0 |
| Luxembourg | 19.0 |
| Uruguay | 19.0 |
| South Africa | 18.9 |
| Europe & Central Asia (all income levels) | 18.7 |
| Tajikistan | 18.7 |
| Israel | 18.7 |
| Netherlands | 18.6 |
| European Union | 18.5 |
| Sweden | 18.4 |
| Burundi | 18.4 |
| Germany | 18.2 |
| Portugal | 18.1 |
| Kuwait | 17.8 |
| Lithuania | 17.6 |
| Gambia, The | 17.5 |
| Azerbaijan | 17.2 |
| Georgia | 17.2 |
| Denmark | 17.2 |
| Venezuela, RB | 17.0 |
| Hungary | 16.7 |
| Dominican Republic | 16.7 |
| Cote d’Ivoire | 16.4 |
| Philippines | 15.8 |
| Malta | 15.0 |
| Sierra Leone | 14.9 |
| Papua New Guinea | 14.8 |
| Guatemala | 14.6 |
| United Kingdom | 14.3 |
| El Salvador | 14.2 |
| Iceland | 14.1 |
| Greece | 14.0 |
| Macao SAR, China | 12.3 |
| Pakistan | 11.8 |
| Angola | 10.7 |
| Swaziland | 10.4 |
| Zimbabwe | 6.5 |
depr
Source: World Bank
Sir , very good explaination on NI
Please differentiate Gross fixed capital formation
and net fixed capital formation
Good explanation on gross fixed capital formation. Please sir, can one use total capital investment in place of gross capital formation
Sir.
What is the relation between inflation and GFCF positive or negative ?