An indifference curve is a line showing all the combinations of two goods which give a consumer equal utility. In other words, the consumer would be indifferent to these different combinations.
Example of choice of goods which give consumers the same utility
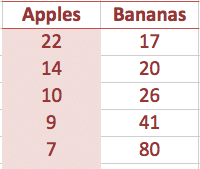
Table plotted as indifference curve

Diminishing marginal utility
The indifference curve is convex because of diminishing marginal utility. When you have a certain number of bananas – that is all you want to eat in a week. Extra bananas give very little utility, so you would give up a lot of bananas to get something else.
Indifference curve map
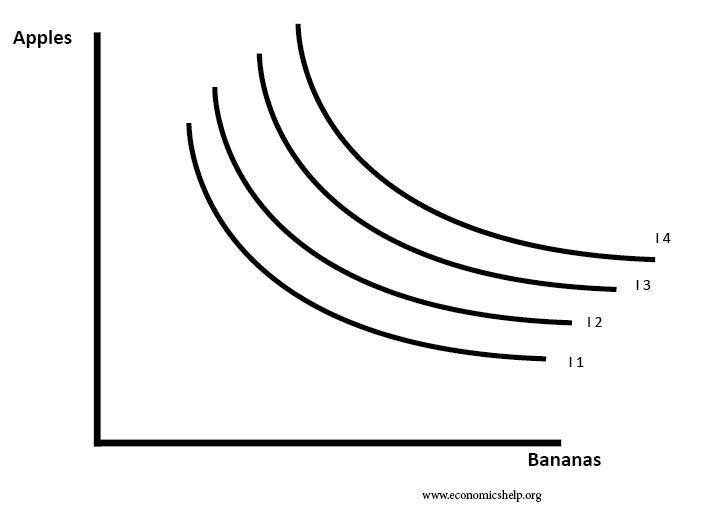
We can also show different indifference curves.
All choices on I2 give the same utility. But, it will be a higher net utility than indifference curve I1.
I4 gives the highest net utility. Basically, I4 would require higher income than I1.
Budget line
A budget line shows the combination of goods that can be afforded with your current income.
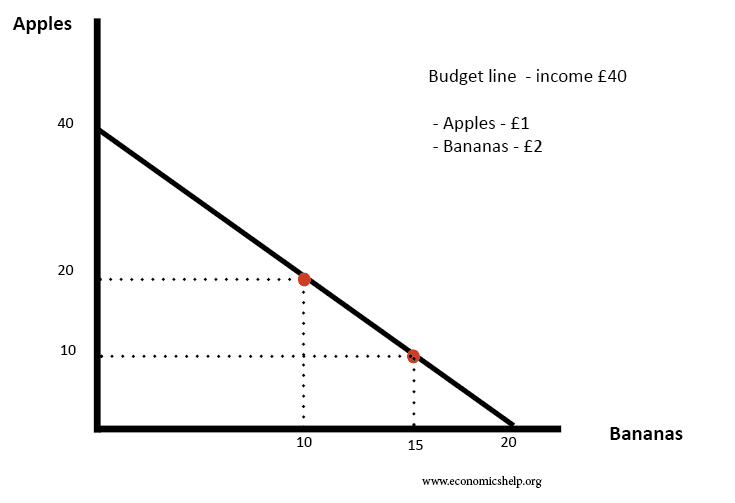
If an apple costs £1 and a banana £2, the above budget line shows all the combinations of the goods which can be bought with £40. For example:
- 20 apples @ £1 and 10 bananas @£2
- 10 apples @£1 and 15 bananas @£2
Optimal choice of goods for consumer
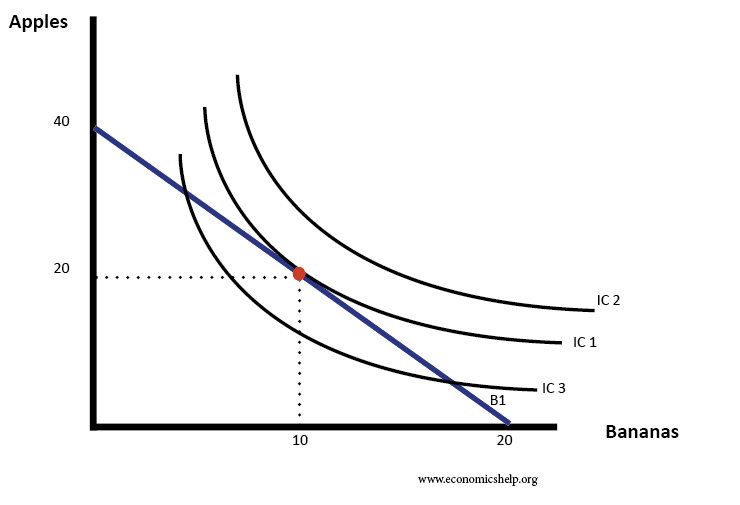
- Given a budget line of B1, the consumer will maximise utility where the highest indifference curve is tangential to the budget line (20 apples, 10 bananas)
- Given current income – IC2 is unobtainable.
- IC3 is obtainable but gives less utility than the higher IC1
- The optimal choice of goods can also be shown with the Equi-marginal principle
Income-consumption curve
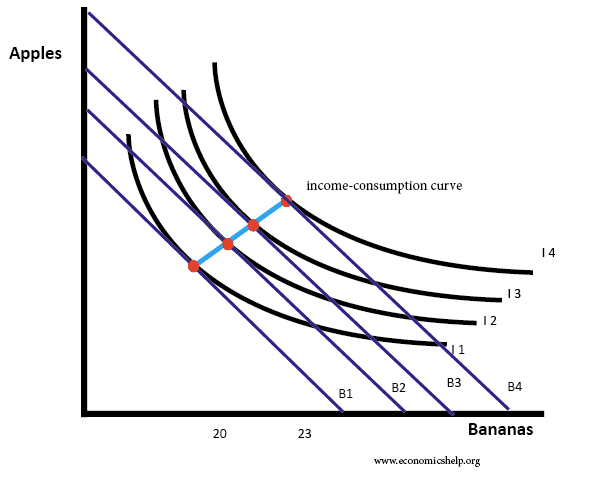
As income rises, you can afford to consume on higher indifference curves. This optimal choice will shift to the right. This we can plot consumption as income rises.
Impact of lower price
With a lower price of bananas (from £2 to £1.50), we can now afford more bananas with the same income. The budget line shifts to the right
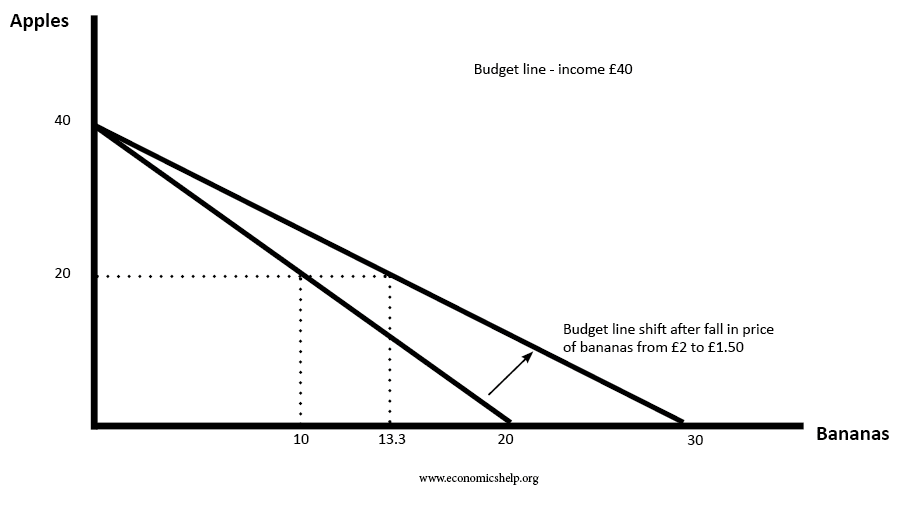
With lower prices, we can now consume at a higher indifference curve of IC2, enabling more bananas and apples.
Income and substitution effect of a rise in price
When the price of a good rises. People buy less for two reasons
- Income effect. This looks at the effect of a price increase on disposable income. If the price of a good increases, then consumers will have relatively lower disposable income. For example, if the price of petrol rises, consumers may not be able to afford to drive as much, leading to lower demand.
- Substitution effect. This looks at the effect of a price increase compared to alternatives. If the price of petrol rises, then it is relatively cheaper to go by bus.
Income and substitution for a normal good
- A rise in price changes the budget line. You can now buy less of good Bananas. The budget curve shifts to B2
- Consumption falls from point A to point C (fall in Quantity of bananas from Q3 to Q1
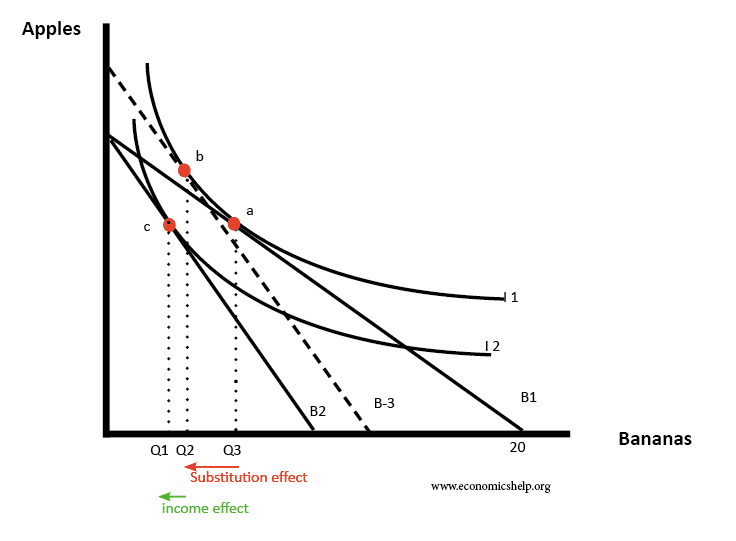
To find different substitution and income effects.
- We draw a new budget line parallel to B2 but tangential to the first indifference curve.
- Being tangential to first indifference curve it enables the consumer to obtain the same utility as before (as if there was no change in income.)
- By focusing on B-3, we are examining the effect of price change – ignoring any income effect.
- The change from A to B (Q3 to Q2) is purely due to the substitution effect and relative price change.
Income effect
- However, income has fallen causing the consumer to choose from a lower indifference curve I2. The change due to income is, therefore, b to C (Q2 to Q1.)
- In this case of a normal good, the income and substitution effect reinforce each other – both leading to lower demand.
Effect of a rise in the price of an inferior good
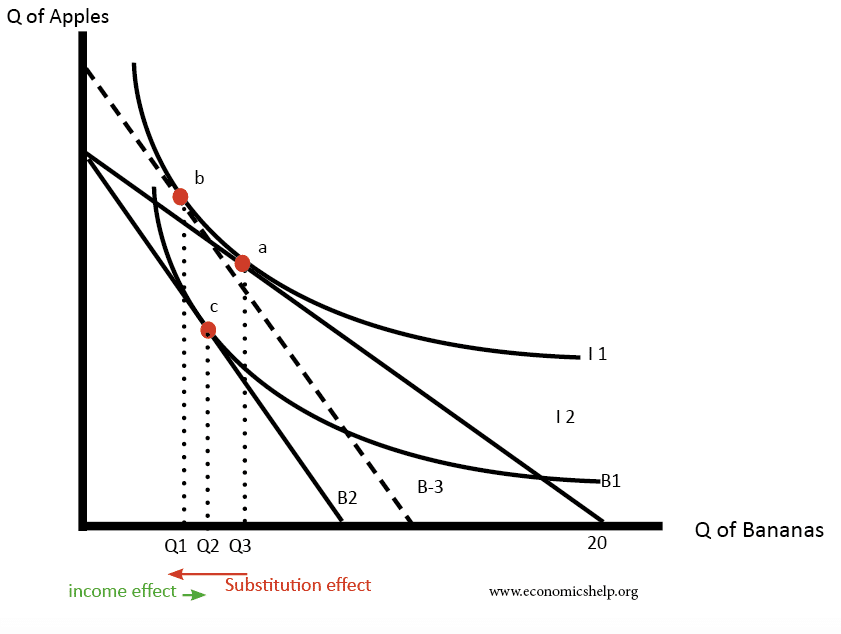
- The substitution effect (using a parallel budget line of B-3) causes a big fall from a to b.
- However, the income effect leads to an increase in demand (Q1 to Q2)
- Overall demand falls, but the substitution effect is partly offset by the income effect.
- This is because when income falls, the decline in income causes us to buy more inferior goods because we can’t afford normal / luxury goods anymore.
Giffen goods
A Giffen good occurs when the income effect outweighs the substitution effect. This is quite rare, but it is theoretically possible for poor peasants who have a choice between expensive meat and cheap rice.

We start at Q2, the rise in the price of rice, reduces the budget line for rice to B2. But, the fall in income causes a large income effect that outweighs the substitution effect. Demand for rice rises to Q3 with a big fall in demand for meat.
Related