- An isoquant shows all combination of factors that produce a certain output
- An isocost show all combinations of factors that cost the same amount.
- Isocosts and isoquants can show the optimal combination of factors of production to produce the maximum output at minimum cost.
Definition isoquant
An isoquant shows all the combination of two factors that produce a given output
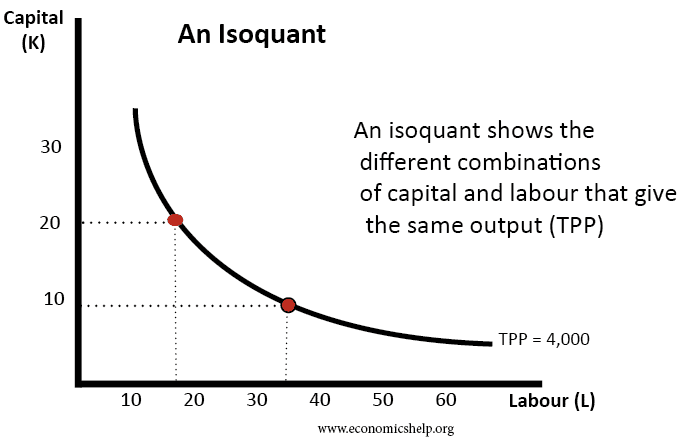
In this diagram, the isoquant shows all the combinations of labour and capital that can produce a total output (Total Physical Product TPP) of 4,000. In the above isoquant, this could be
- 20 capital and 18 labour or (more capital intensive)
- 9 capital and 35 labour. (more labour intensive
An isoquant is usually shaped convex to the origin because of the law of Marginal Rate of Technical Substitution (MRTS) which means there are diminishing returns from using more of one factor of production.
Marginal rate of factor substitution
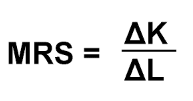
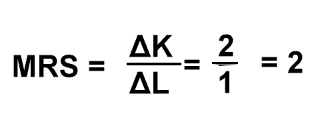
The marginal rate of substitution is the amount of one factor (e.g. K) that can be replaced by one factor (e.g. L). If 2 units of capital could be replaced with one-factor labour, the MRS would be 2
Diminishing marginal rate of substitution
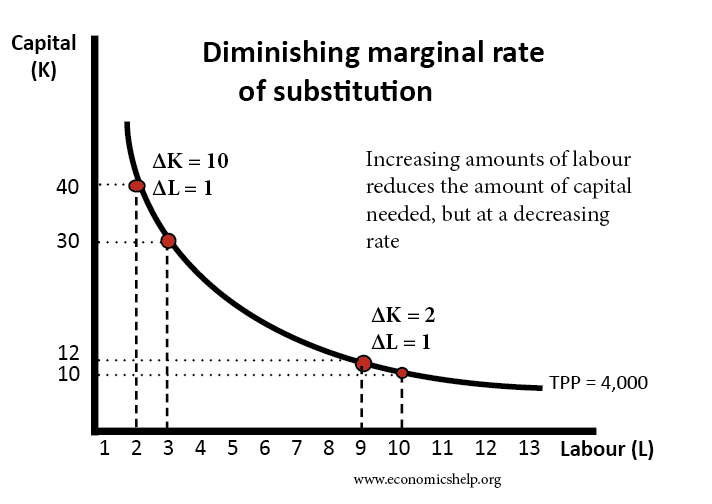
If the firm employs 2 L and 40 K. Then employing one extra worker can enable it to save 10K. This is quite an efficient saving. The firm only has to pay one extra worker but can save the cost of 40.
However, at a combination of 9 Labour, employing an extra worker enables a saving of only 2 capital. Therefore, the more that workers are employed, there is diminishing rate at which you can substitute the other factor. There comes a point, where employing more workers barely saves any capital at all. This is when diminishing returns of labour is very high – workers effectively get in each other’s way.
As one moves down the isoquant, output remains the same. Therefore the output gained from employing more labour must equal the output lost from employing more capital.
MPP (L) x ΔL = MPP (K) x ΔK
This equation gives us

Isoquant map
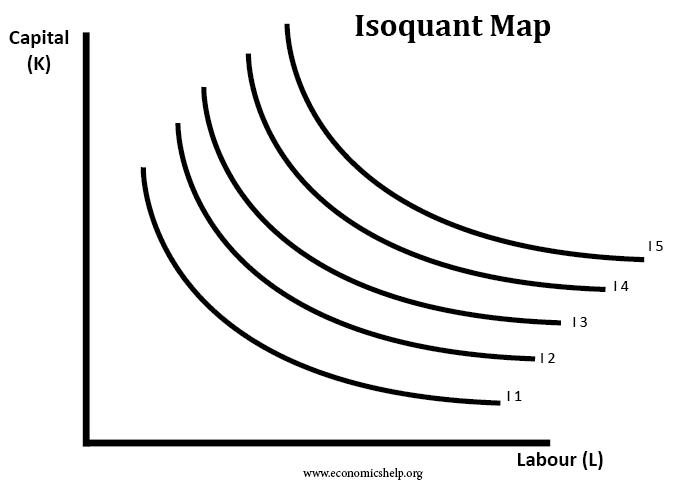
An isoquant map shows different levels of output. For example
- I1 may show the combinations of capital and labour that can produce 4,000 TPP.
- I2 may show the combinations of capital and labour that can produce 5,000 TPP.
- I5 is a higher output than I4
In the short-term, a firm faces a trade-off along one particular isoquant. But, in the long-term, a firm can invest in increasing capital stock and produce at a higher output for the same quantity of labour.
Isocost
An isocost shows all the combinations of factors that cost the same to employ.
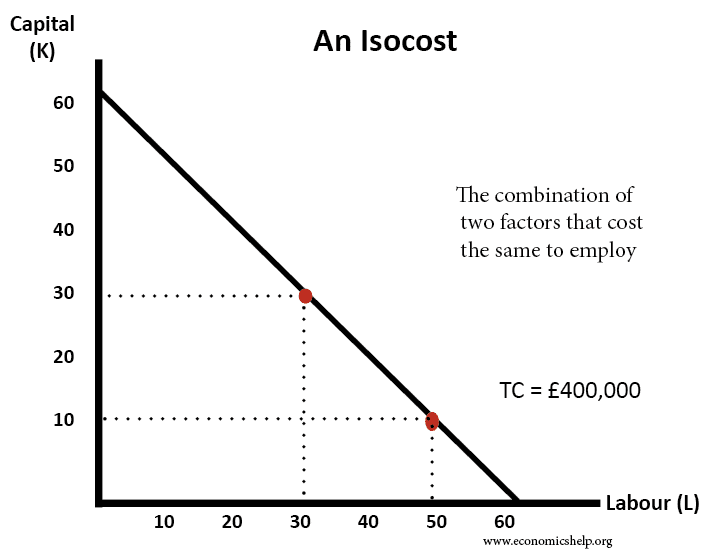
In this example, a unit of labour and capital cost £6,666 each.
- If we employ 30K and 30L, the total cost will be £200,000 + £200,000
- If we employ 10 K and 50L, the total cost will be £66,666 +£333,333 = £400,000
Change in labour costs
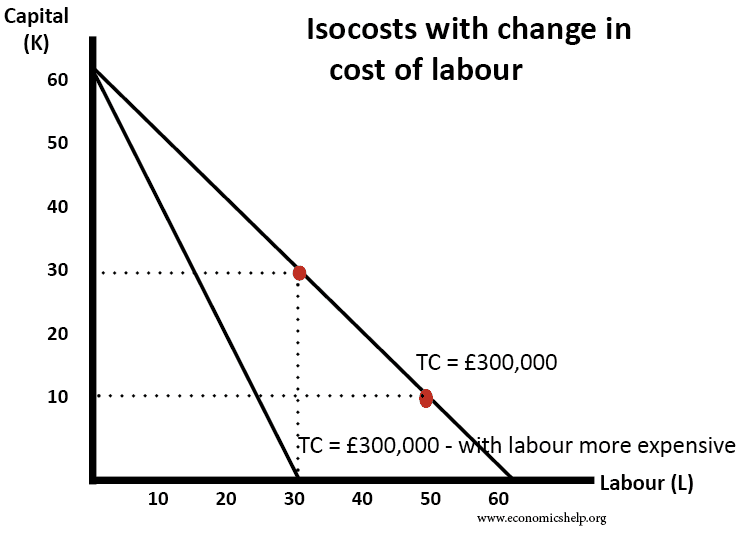
- In this example, initially, the cost of labour and capital is both £5,000. (e.g. 60L = 60 x £5,000 = £300,000)
- However, if Labour cost rises to £10,000, then the isocost shifts to the left. Now, to keep cost at £300,000, a firm could only employ 30 workers (30 x £10,000)
- The slope of an isocost is, therefore, Pι / Pκ
Profit maximisation
To maximise profits, a firm will wish to produce at the point of the highest possible isoquant and minimum possible isocost
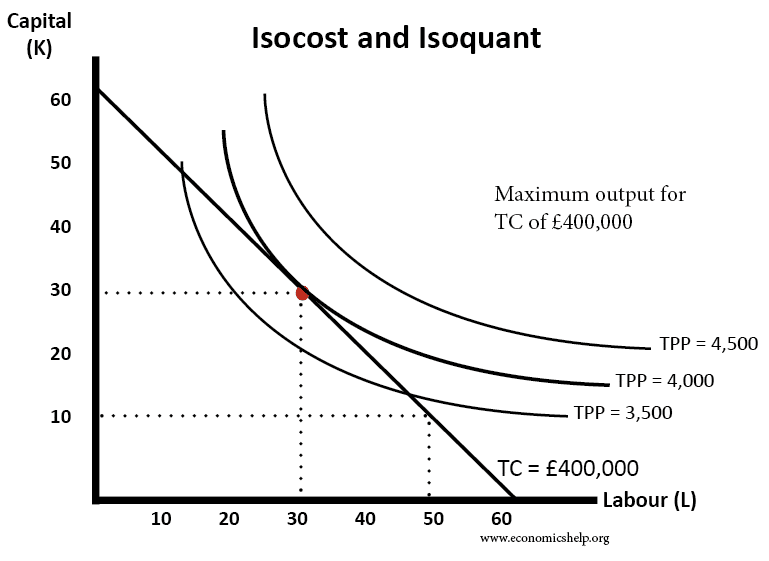
In this example, we have one isocost and three isoquants. With the isocost of £400,000 the maximum output a firm can manage would be a TPP of 4,000. If it produced at say 13 K and 48 Labour, it would only be able to produce a TPP of 3,500.
A total TPP of 4,500 is currently not possible without increasing costs beyond £400,000
Profit maximisation – the least cost method of production
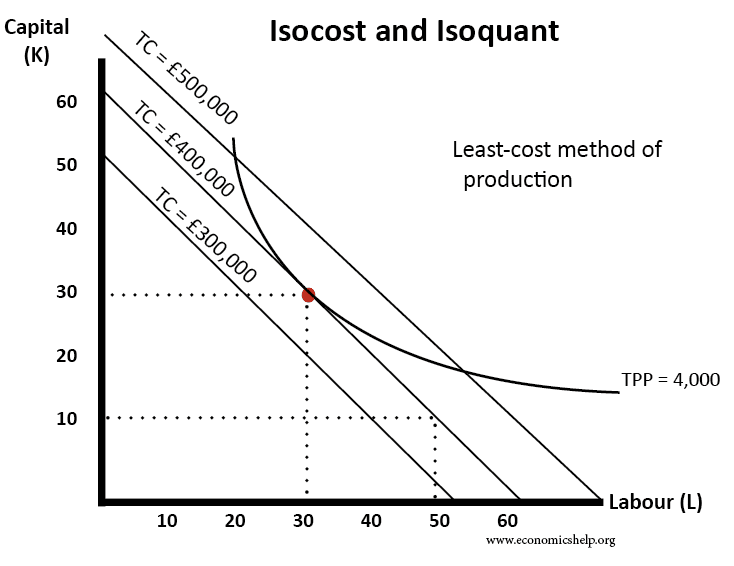
Another way of seeking to maximise profits is to target an output of say 4,00 and then find the isocost with the lowest possible cost. In this case, the isocost which touches the tangential point of the TPP is a TC of £400,000.
Related
