- Definition: The Lorenz curve is a way of showing the distribution of income (or wealth) within an economy. It was developed by Max O. Lorenz in 1905 for representing wealth distribution.
- The Lorenz curve shows the cumulative share of income from different sections of the population.
- If there was perfect equality – if everyone had the same salary – the poorest 20% of the population would gain 20% of the total income. The poorest 60% of the population would get 60% of the income.
Diagram of Lorenz curve

In this Lorenz curve, the poorest 20% of households have 5% of the nation’s total income.
The poorest 90% of the population holds 55% of the total income. That means the richest 10% of income earners gain 45% of total income.
Shift in the Lorenz Curve

In this example, there has been a reduction in inequality – the Lorenz curve has moved closer to the line of equality.
- The poorest 20% of the population now gain 9% of total income
- The richest 10% of the population used to gain 45% of total income but now only get 25% of total income.
The Lorenz Curve and the Gini Coefficient
The Lorenz Curve can be used to calculate the Gini coefficient – another measure of inequality.
The Gini coefficient is area A/A+B
The closer the Lorenz curve is to the line of equality, the smaller area A is. And the Gini coefficient will be low.
If there is a high degree of inequality, then area A will be a bigger percentage of the total area.
A rise in the Gini coefficient shows a rise in inequality – it shows the Lorenz curve is further away from the line of equality.
Lorenz Curve and wealth
Wealth Inequality and Lorenz curve
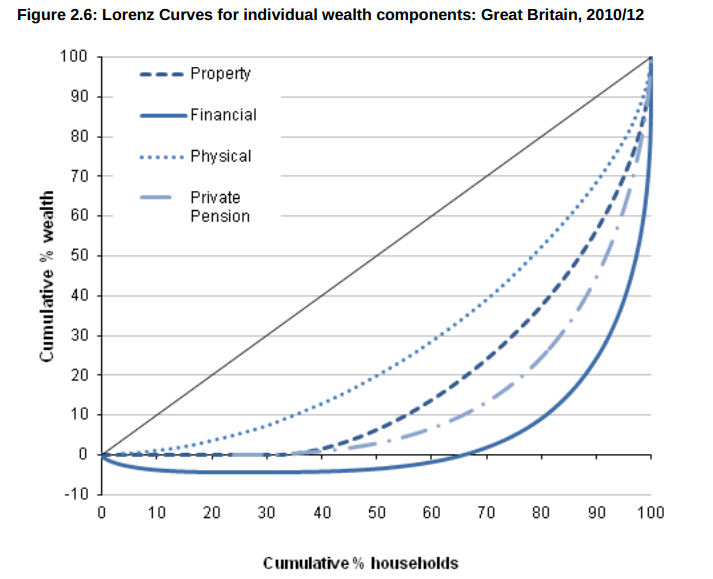
The Lorenz curve shows the cumulative wealth of each wealth decile. It shows that the lowest 38% of individuals have zero property wealth. The top 10% own nearly 50% of property wealth.
With financial wealth, inequality is even greater with 60% of the population in debt and negative wealth. The top 10% have 80% of the nations financial wealth.
Source:
- Wealth in Great Britain ONS, published July 2012
Gini Coefficient in the UK

The original Lorenz Curve

American Statistical Association June 1905 JSTOR
Interestingly, the original Lorenz curve had percents of total income and percents of the population on different axis.
Related