Poverty implies low income and struggling to meet basic needs. There are two main types of poverty
- Absolute poverty – income below a certain threshold necessary to meet basic necessities of life (food, shelter, clothing, rent)
- Relative poverty – Individuals receiving income a certain level (e.g. 50%) below the median income of the general population.
Definitions of absolute poverty do not change with economic growth. Usually, if average incomes rise, then more of the population should be lifted out of absolute poverty. However, if economic growth is unequal and high-income earners receive larger pay increases than low-income earners – relatively poverty can increase.
Definition of Poverty by United Nations
1. Absolute poverty – “a condition characterised by severe deprivation of basic human needs, including food, safe drinking water, sanitation facilities, health, shelter, education and information. It depends not only on income but also on access to services.”
UN World Summit for economic development (1995)
2. Multi-dimensional poverty index MDI
Multidimensional Poverty Index (MPI) published by the UN in 2010. It measures poverty as an acute deprivation of essential aspects of life. It measures three key targets – living standards, education and healthcare.
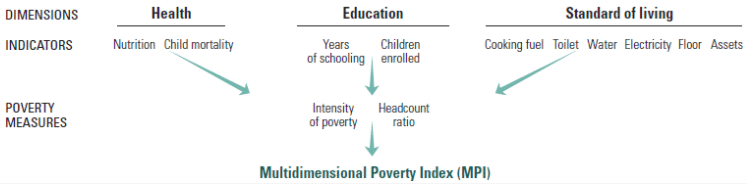
MPI at United Nations
Measures of poverty in the UK
The main measures of poverty in UK are
1. Households 60% Below Average Incomes (HBAI)
HBAI measures “equivalised disposable income that falls below 60% of the national median.”
- Equivalised means taking into account size of household.
- Disposable income includes wages, benefits – tax
- In 2015, the UK Poverty threshold was £12,567.
- See: ONS on relative poverty
- HBAI at Dept Work and Pensions
2. Persistent poverty. This is defined as a household which is below the poverty threshold line for 2 out of the past 3 years.
3. Absolute Low income. This sets a threshold as a proportion of the UK average income in a particular year (2010/11) and changes only in line with inflation. Thus rising wages could be expected to reduce absolute low income – even if inequality increases.
Graphs to show UK poverty
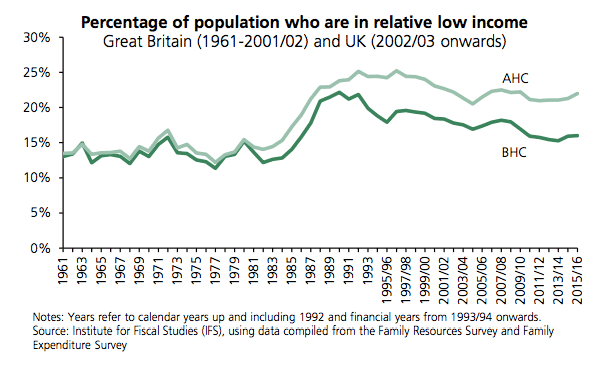
The 1980s saw an increase in relative poverty – due to increased income inequality. After 1992, housing costs increasingly have become a cause of relative poverty.
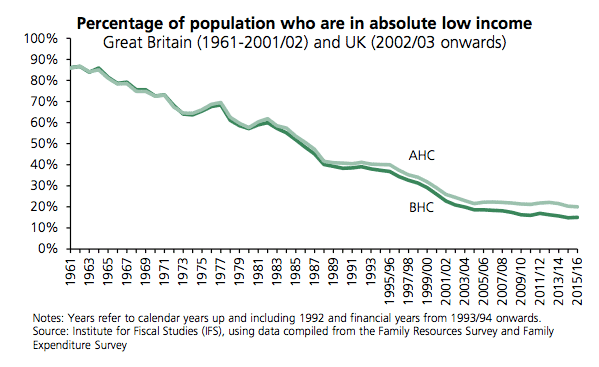
Using a measure of absolute poverty, there has been a significant improvement – with the number living below the poverty threshold (adjusted for inflation) has fallen.
Poverty in Past two decades
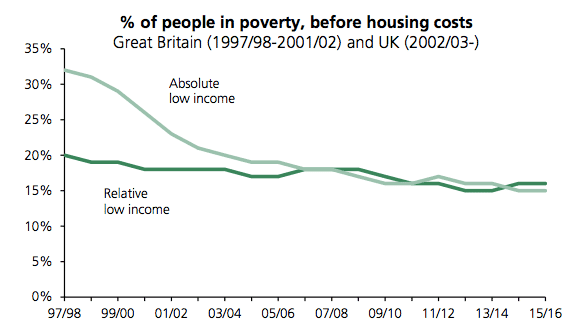
Using measures of relative poverty, the percentage of the population with income 60% below media has shown very small fall.
However, using the absolute income level, there was significant fall in poverty between 1997 and 2007. This was a period of rising real incomes.
After housing costs
After housing costs increase the incidence of relative poverty.

Gini coefficient
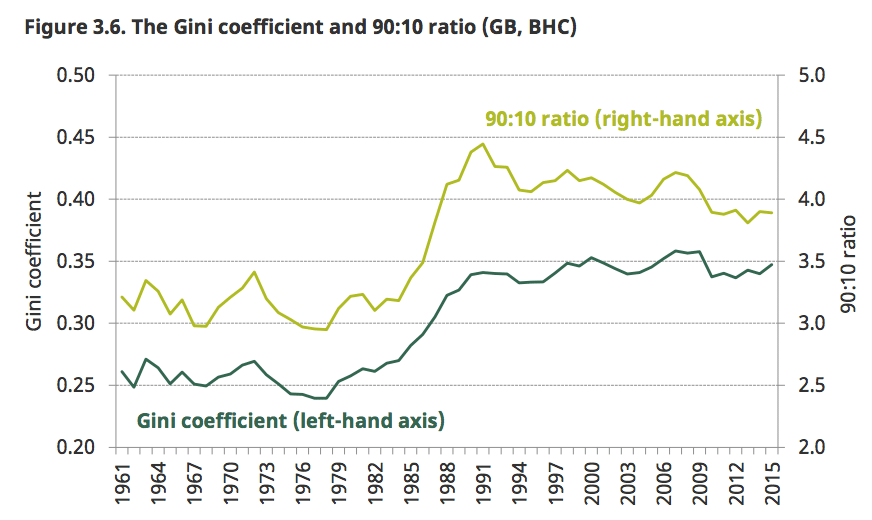
The Gini coefficient is a measure of inequality. It is closely linked to trends in relative household income.
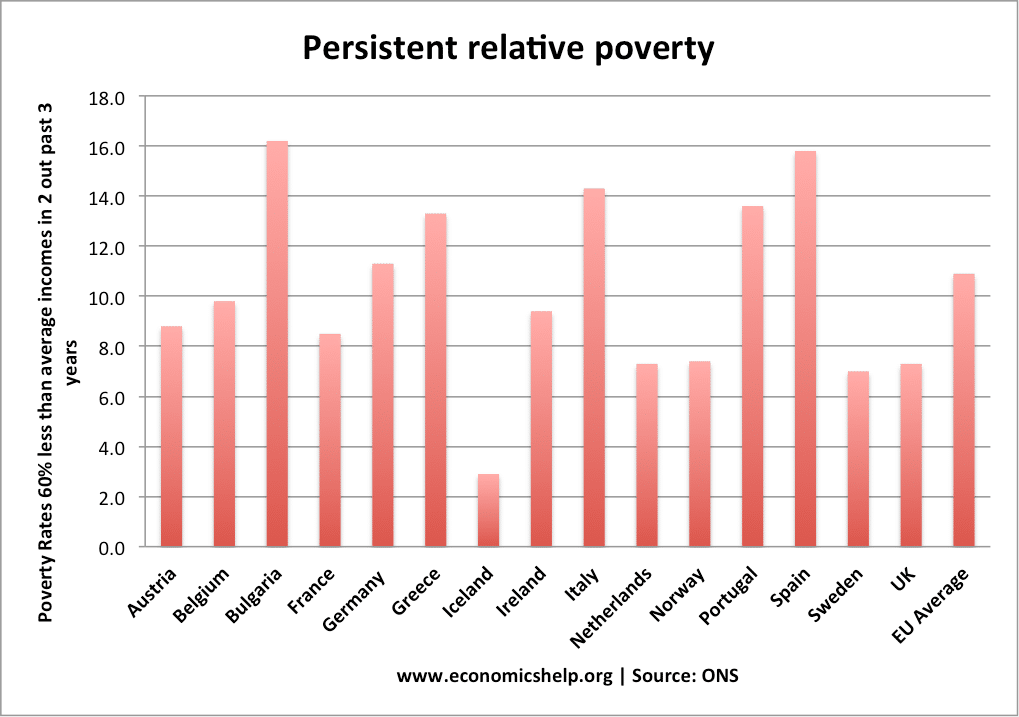
Persistent relative poverty at ONS
Other useful measures for understanding relative poverty
Real wages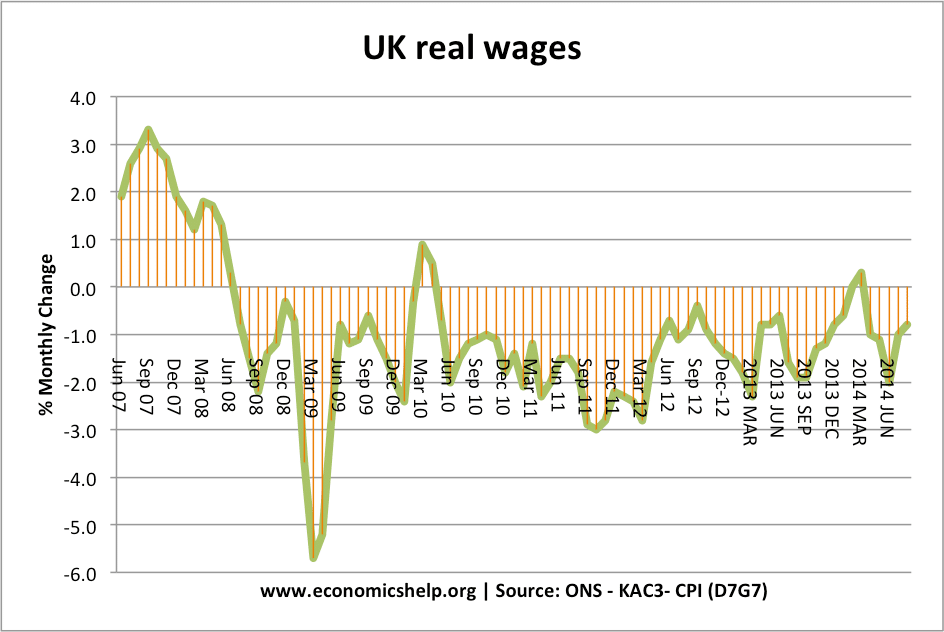
- Homelessness rates
- Unemployment rate
- Use of food banks
Source of graphs on poverty
- Research paper on poverty in the UK 16 June 2016 pdf
Related
What are the best way to become a best economist, and guide me please the easiest ways to get the most useful concept in international economics. Thank you for your help