Definition of Consumer Surplus
- This is the difference between what the consumer pays and what he would have been willing to pay.
- For example: If you would be willing to pay £50 for a ticket to see the F. A. Cup final, but you can buy a ticket for £40. In this case, your consumer surplus is £10.
Definition of producer surplus
- This is the difference between the price a firm receives and the price it would be willing to sell it at.
- If a firm would sell a good at £4, but the market price is £7, the producer surplus is £3.
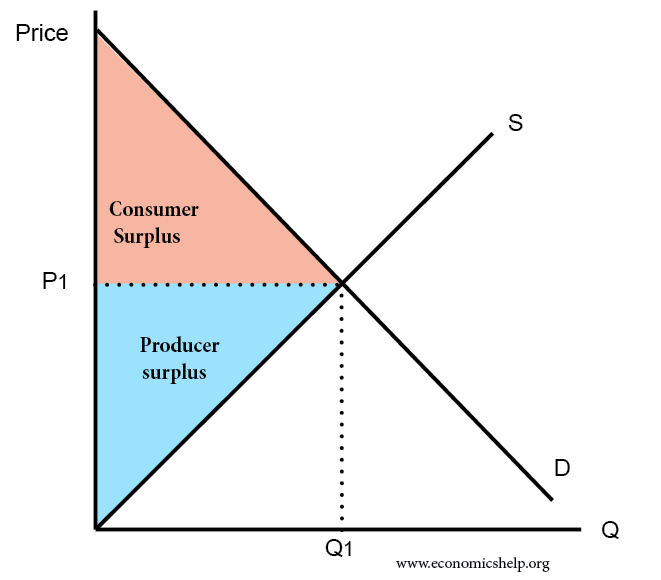
Diagram of Consumer Surplus
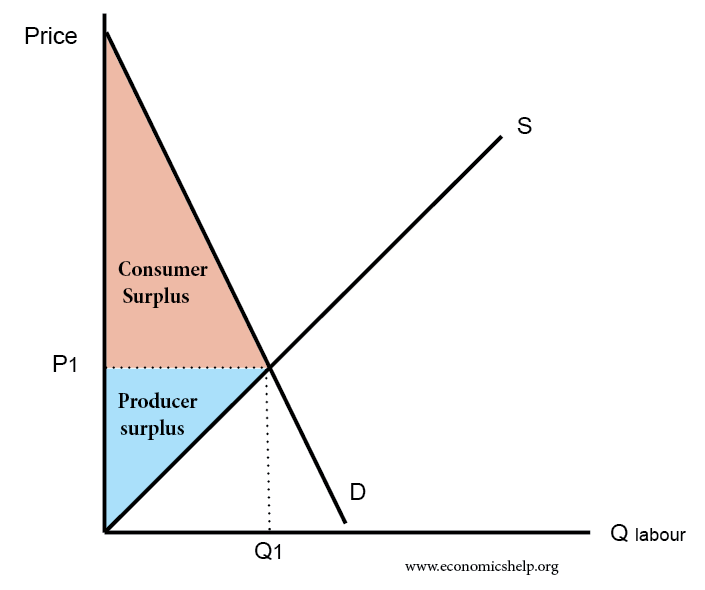
How elasticity of demand affects consumer surplus
If demand is price inelastic, then there is a bigger gap between the price consumers are willing to pay and the price they actually pay.
The demand curve shows the maximum price that a consumer would have paid. Consumer surplus is the area between the demand curve and the market price.
If the demand curve is inelastic, consumer surplus is likely to be greater
- Monopolies are able to reduce consumer surplus by setting higher prices
- Price Discrimination is an attempt to extract consumer surplus by setting.
Consumer surplus and marginal utility theory
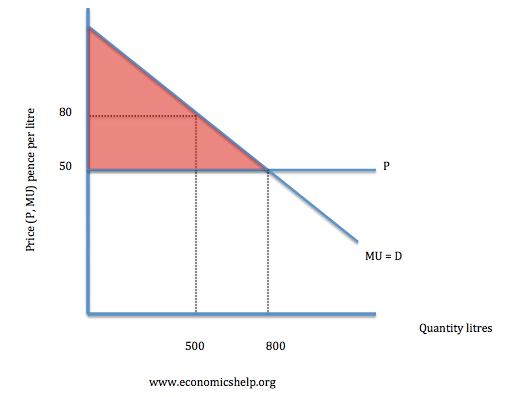
The demand curve illustrates the marginal utility a consumer gets from consuming a product. At quantity 500 litres, the marginal utility is £0.80 – which indicates the marginal utility is 80p. However, with a price of 50p, the consumer surplus is the difference.
Producer Surplus
- This is the difference between the price a firm receives and the price it would be willing to sell it at.
- Therefore it is the difference between the supply curve and the market price
How free trade affects consumer and producer surplus
Free trade means a reduction in tariffs. It leads to lower prices for consumers and an increase in consumer surplus
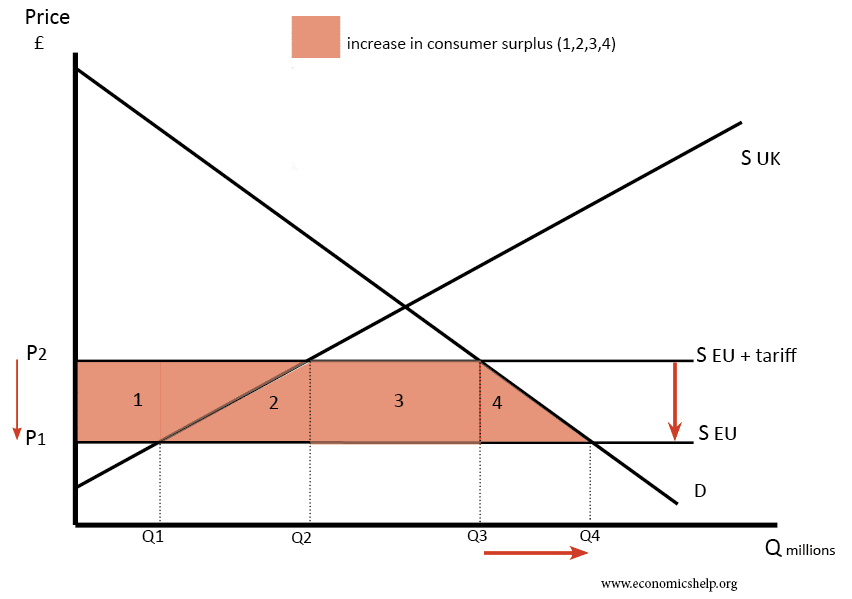
- If tariffs are cut, then we can import at S Eu (P1) – a lower price than P2.
- Imports increase from (Q3-Q2) to (Q4-Q1)
- However, domestic producers see a decline in producer surplus.
- WIth tariffs, we used to buy Q2 from domestic producers. But, now we only buy Q1 at price P1.
- So area 1 represents the decline in producer surplus.
Related
Your information on Economics is really helpful Thank you …
Thank you
thank you
Thank you
Please help me with this question :
The uk government are attempting to increase consumer and producer supply
Para 1 supply + demand curve
Para 2 fiscal / monetry policy
Para 3 Positive / negative of increased demand
Para 3 negative increase supply
Thank you
Thyank you
your explanation on consumer surplus is very okay,THANK YOU
A very vital information on consumer surplus.Thank you
Very vital information about customer surplus and producers surplus
Your explainations are relevant and easily understood, thank you
its really understandable information , thanks
Thank you for the explanation on consumer surplus and producer surplus.
like your explanations
Was so helping
EH – MAZING website