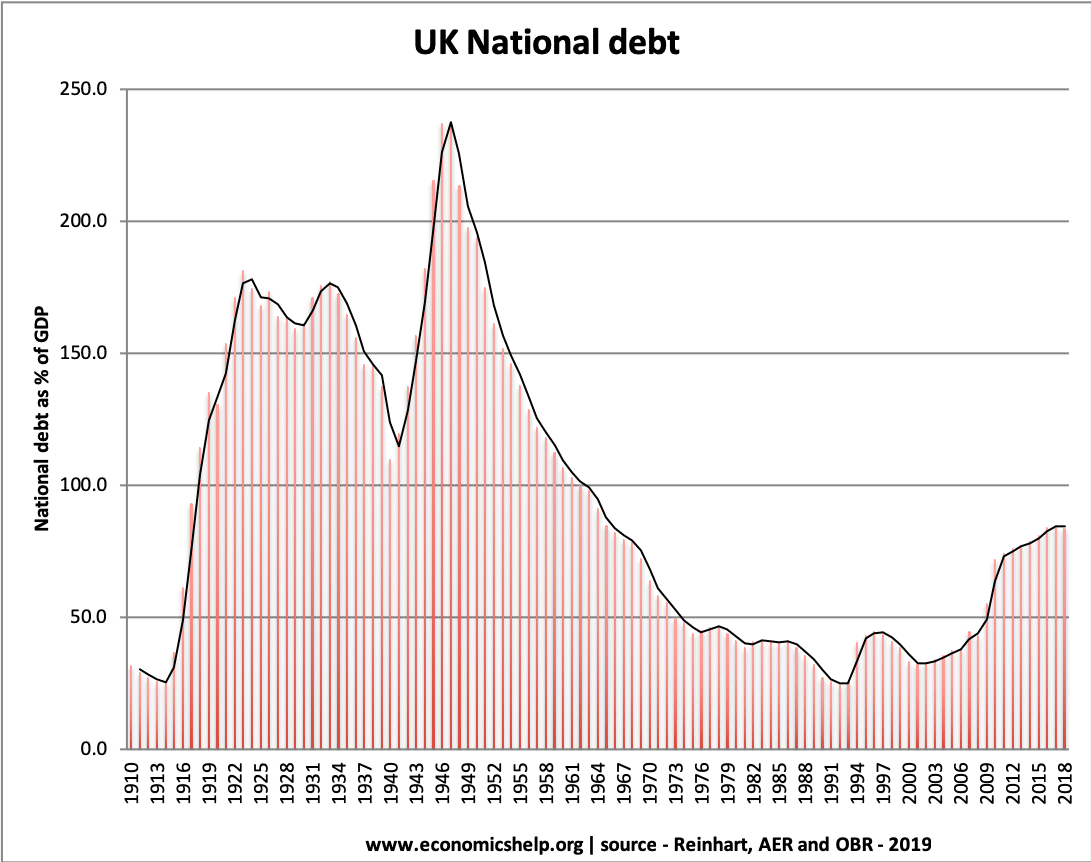
Readers Question. I greatly appreciate the time that you took to try to explain our debt situation. (History of National Debt / GDP) One thing that still confuses me is why our debt actually rose during a sustained time period where debt/GDP charts showed that it shrank.
This is very important. (and I wish those with political power would pay more attention to this.)
- Suppose, US Debt is $10 trillion and US GDP is also $10 trillion. The national debt would be 100% of GDP.
- Then, over five years let us assume, national debt rises to $12 trillion. This is a 20% increase in public sector debt.
Two Scenarios
1. Zero Growth Suppose, we have a ‘lost decade’ i.e. like Japan, the US, gets stuck in a liquidity trap and averages zero growth over this time frame. Then debt to GDP would increase. After five years of zero growth, debt to GDP would be 12/ 10 = 120% of GDP
2. High growth. Suppose in these five years, economic growth averages 5%. That means real GDP would increase to $12.5 trillion.
Therefore, debt / GDP ratio would be 12/12.5 = 96% of GDP.
Therefore, in the second example, the national debt has risen by $2 trillion. But, as a % of GDP, debt has fallen. This means, (ceteris paribus) the government can spend less on interest payments to meet the cost of servicing debt – even though the debt has increased.
3. Austerity. Suppose policymakers become concerned about the growth in national debt from $10 trillion to $12 trillion. To ‘reassure markets’, they embark on spending cuts of $1 trillion. Public sector workers get pay cuts or job losses.
But, the problem of these spending cuts and job losses, is that it causes a fall in aggregate demand! This leads to lower GDP (a double-dip recession).
- As a result of austerity, debt only rises 10% from $10 trillion to $11 trillion.
- But, let us assume GDP falls from $10 trillion to $9 trillion.
- The debt to GDP ratio now increases to 11/9 = 122% of GDP.
- Therefore the government actually needs to spend a higher share of national income on debt interest payments. To pay for the spending cuts, they have to increase taxes to pay more interest.
Evaluation
Some would argue that if you cut government spending, it doesn’t lead to a fall in AD. The argument is that government spending is wasteful, and if we cut government spending, we enable the private sector to expand. A public sector job loss leads to job creation in the private sector. Therefore, we can cut spending without causing a fall in GDP.
This is definitely possible. Countries have cut spending without causing a fall in GDP.
However, this usually occurs when they are able to boost demand in another way. e.g. Devaluation of the exchange rate, cut in interest rates, boost to the money supply. Many European countries are trying to cut government spending, but there is no devaluation, no boost to exports and no loosening of monetary policy. Therefore it is much more difficult.
Also, we are currently in a liquidity trap, bond yields are falling, the private sector wants to save not spend. Cutting government spending has definitely not ‘increased confidence’ as many policymakers vainly hoped.
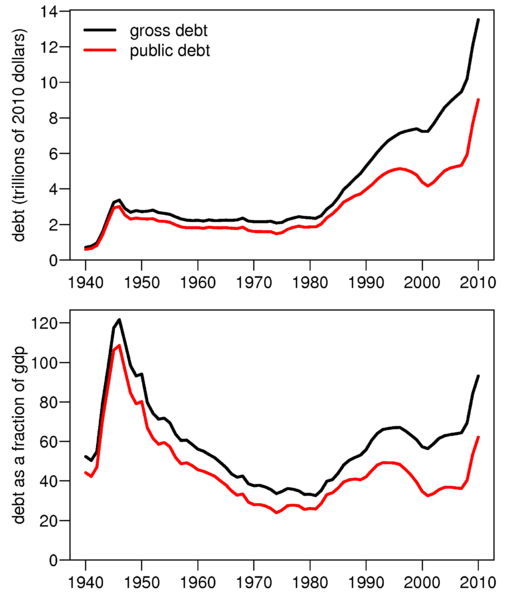
As you can see below, there have been times, when US debt rose, but Debt to GDP fell. This is because high economic growth enabled a fall in the debt to GDP ratio.
Markets are currently worried that we have a combination of high debt, but mainly the prospects for growth have fallen. Therefore debt / GDP ratios are rising.
Related
Looks like about a third of the so called debt is not really debt at all in that it consists of money owed by one US government department to another. See:
http://bilbo.economicoutlook.net/blog/?p=15591