- Income is a flow. It measures the receipt of money per period of time ( e.g. £200 a week)
- Wealth is a Stock. It measures the value of a person’s wealth at a given point in time e.g. £150,000
Distribution of income in the UK
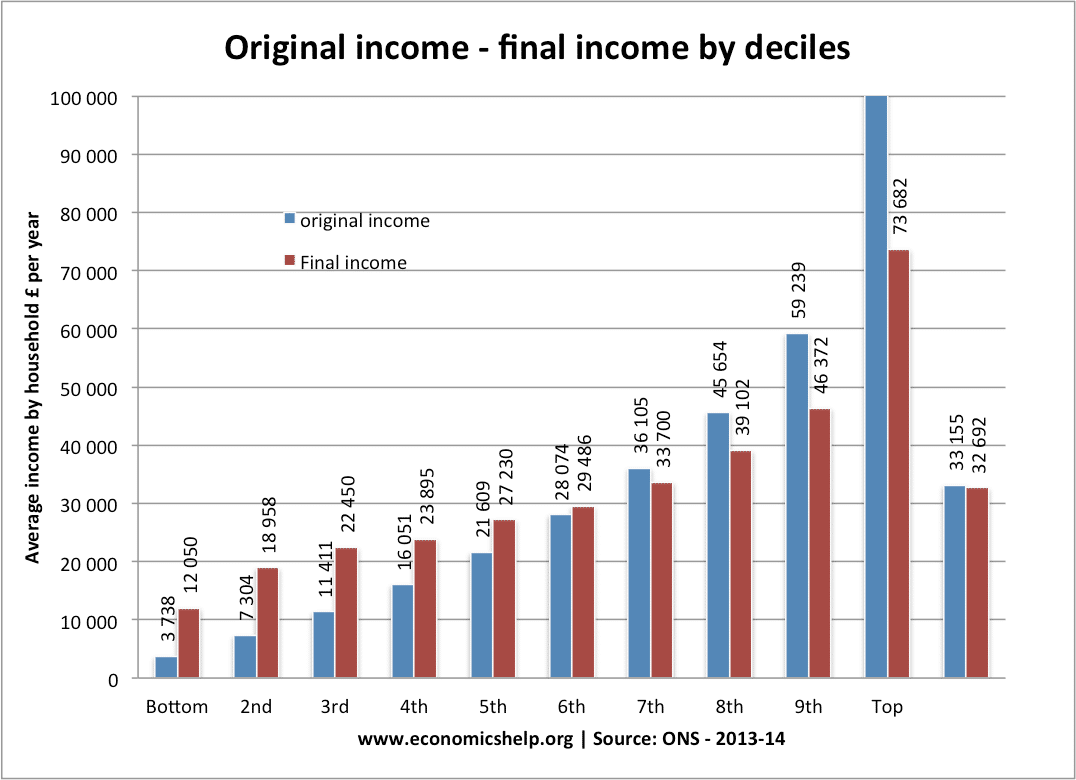
- This shows the top 10% of income earners earnt over £100,000 – though, after tax and benefits, this fell to £73,682.
- By comparison, the poorest 10% of income earners earnt £3,738. After tax and benefits, this rose to £12,050.
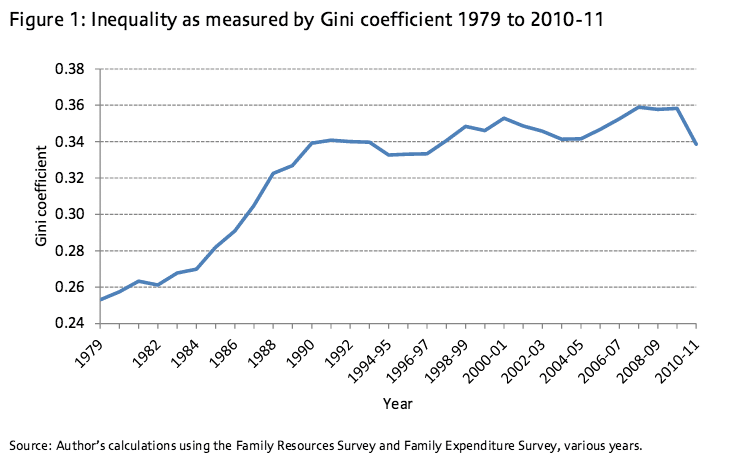
Income inequality measured by Gini coefficient
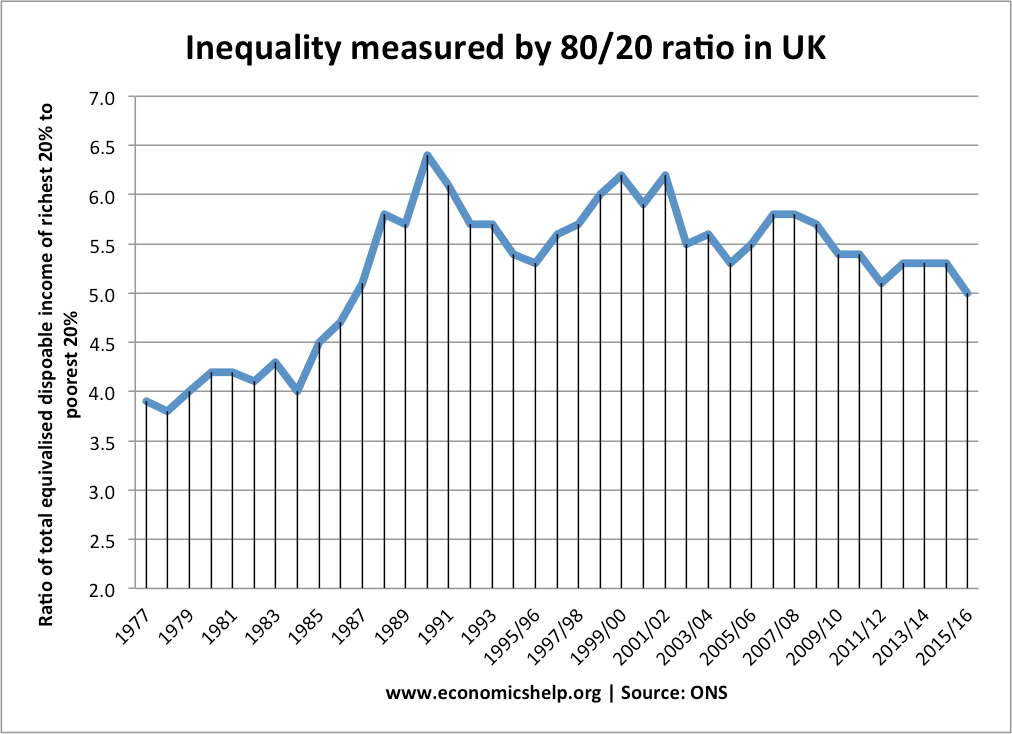
This measures the ratio of income of the richest 20% to the poorest 20%. It shows some decrease in relative inequality between 1992 and 2015/16
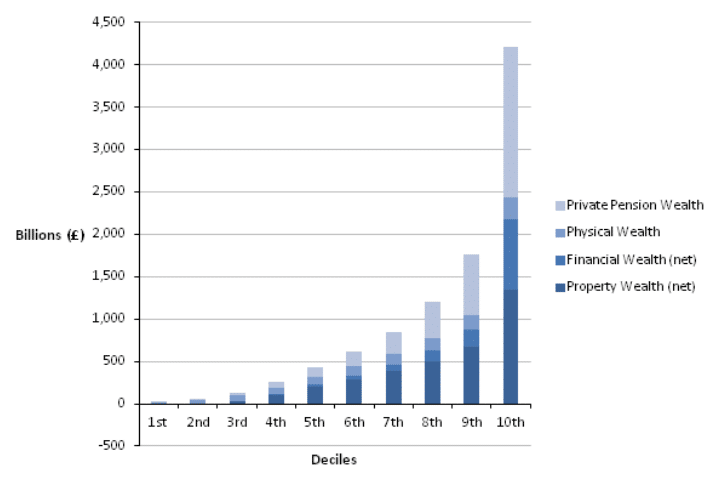
Distribution of wealth
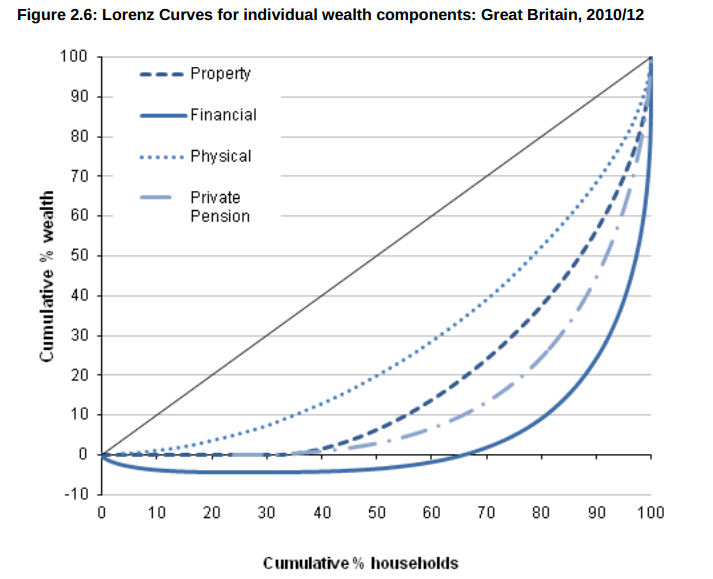
The Lorenz curve shows the cumulative wealth of each wealth decile. It shows that the lowest 38% of individuals have zero property wealth. The top 10% own nearly 50% of property wealth.
With financial wealth, the inequality is even greater. WIth 60% of the population in debt and negative wealth. The top 10% have 80% of the nations financial wealth
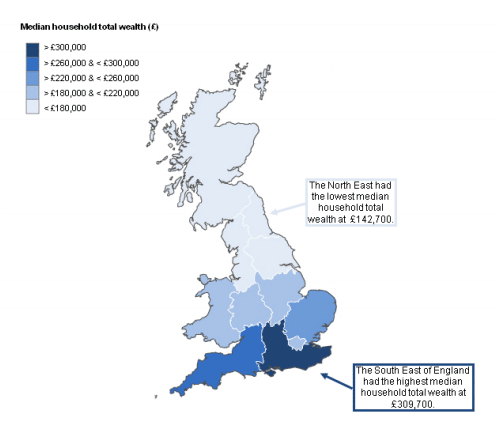
Wealth is also distributed by region.
Related
Source of wealth graphs
- Wealth in Great Britain ONS, published July 2012