When displaying time series data, it often makes sense to use index numbers.
Index numbers are a simple way of making it easier to compare numbers over a period of time. Index numbers measure relative changes in the price of a sum of representative data.
For example, the FTSE-100 is an index displaying the average share price movements of the biggest 100 companies listed on the London Stock market.
In the case of the FTSE-100, companies are given a weighting depending on their stock market capitalisation. The index measures the change in the price of all 100 shares; the price change is also multiplied by the relative weighting of the company. The FTSE -100 index thus gives an overall measure of the performance of average shares.
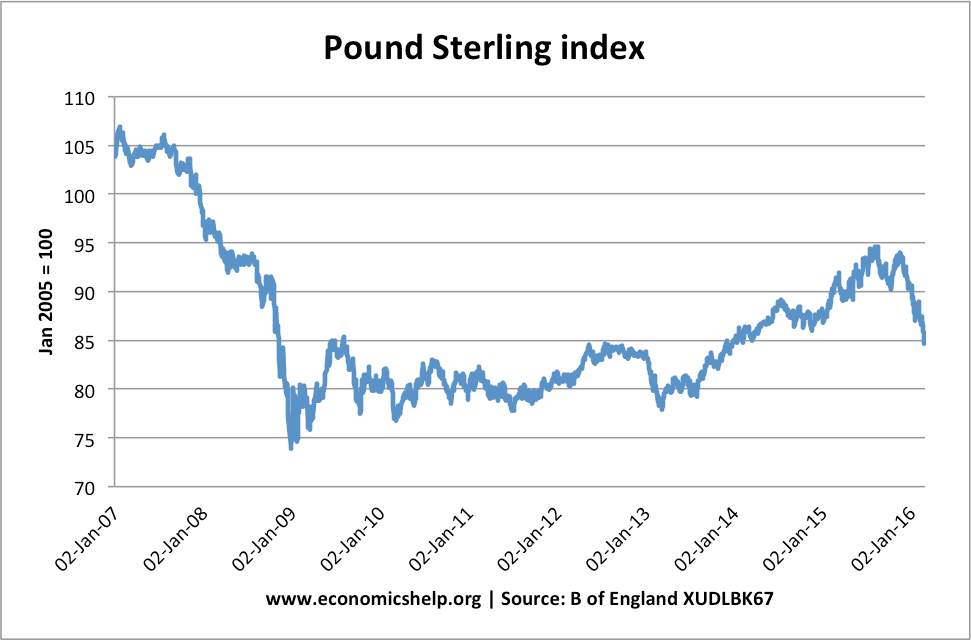
Pound Sterling index
This shows the Pound Sterling index. The base year is 2005. By Jan 2007, the Pound Sterling index had increased about 5%. But, by Jan 2009, it had fallen 25%.
The Pound Sterling index measures the overall value of the Pound – so it measures the Pound against a basket of other currencies (Euro, Dollar, Yen)
Index Numbers and Base Years
To measure the relative change in prices, we often use a base year to provide a reference point for changes in prices.
A base year is chosen (say 2000) in this year the index is set to 100. This is so it is easy to make percentage comparisons.
Therefore, if the general price level increase by 3.4% in the UK. The price index in 2001 would be 103.4
When comparing exchange rates it is often advantageous to use index numbers. For example, currencies can be quite hard to compare. But, when converted into index numbers it is easier to see relative changes of currencies.
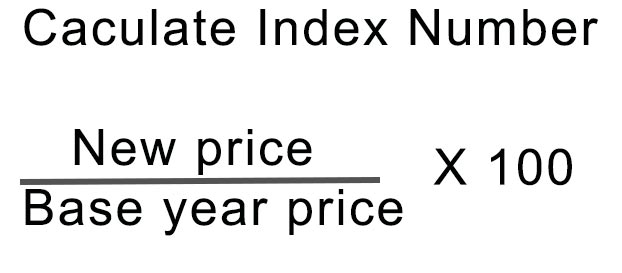
Calculating index number
2000 – Base year price = 45
2001 – New price = 46
Index for 2001 = 46/45 * 100 = 102.22
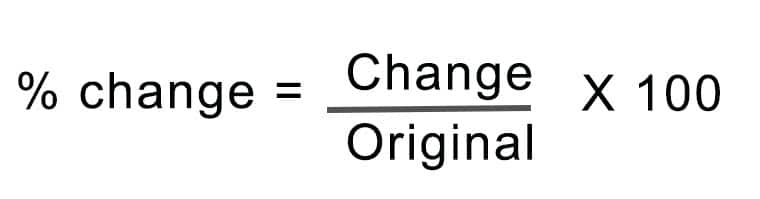
Calculating % change
2000 – Base year price = 45
2001 – New price = 46
Change = (1/45) * 100 = 2.22%
Calculating Real GDP
Real GDP = (Nominal GDP / Price Index of the current year) x 100
Example 1
2020 Nominal GDP = £1,190. Price index = 100
2023 Nominal GDP = £1,410. Price Index = 121
Calculate Real GDP expressed in 2020 prices.
2023 Real GDP = 1,410 *100/121 = £1,165.29
What is economic growth between 2023 and 2010?
Increase in real GDP = 1,165.29 – 1,190 = £ -24.71
Economic growth rate = change in real GDP/Initial real GDP x 100
-24.71/1190 = -2%
What is real GDP in 2023 in 2022 Prices
2022 Nominal GDP = 350 Price index = 100
2023 Nominal GDP = 390. Price Index =108
Real GDP = 390 x 100/108 = 361
Economic growth rate = 11/350 = 3.14%
2022 Nominal GDP = 134. Price index = 107
2023 Nominal GDP = 139. Price index = 109
What is 2023 Real GDP at 2022 Prices
This time in 2022, the price index is 107, rather than 100 (which makes calculation less straightforward
Real GDP = nominal GDP x (price index (2022)/Price index 2023
Real GDP = 134 x (107/109) = 136.45
Growth rate = 2.45/134 = 1.83%
An economy’s GDP increased from £200 billion in 2021 to £228 billion in 2022. Using 2021 as the base year, what is the value of the index for GDP in 2018?
2021 = 100 (base year)
Increase in GDP = 28/200 = 14%
Index in 2018 = 100 +14% = 114
Economist Commodity Price Index
2000=100
Dec 18th, 2007
Dollar Price Index = 217
Dollar price index metals = 237
Sterling Index = 163
Euro Index = 139
These index numbers show that the price of commodities has been increasing throughout the world. The dollar price of commodities has increased more because of the weakness of the dollar.
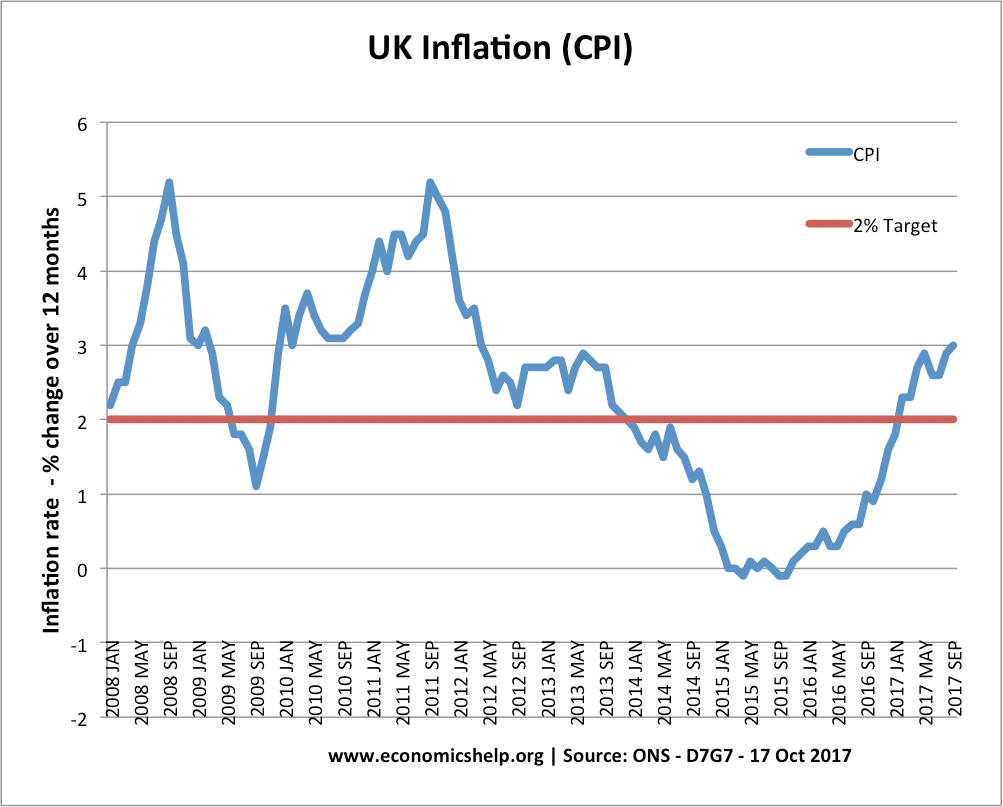
Difficulties in Using Index Numbers
The annual percentage change in the consumer price index.
The most commonly used index number is the Consumer price index. However, this also presents a problem when trying to use an index to measure changes in the cost of living.
One basic difficulty is that the goods bought are constantly changing. Therefore, measuring changes in price is not an accurate reflection of what is happening because the quality of goods may be changing.