This is a collection of diagrams for supply and demand. It is mainly for my benefit, so when creating a post, like the price of tea (or when I’m teaching online) I can easily find a suitable diagram to illustrate what is happening.
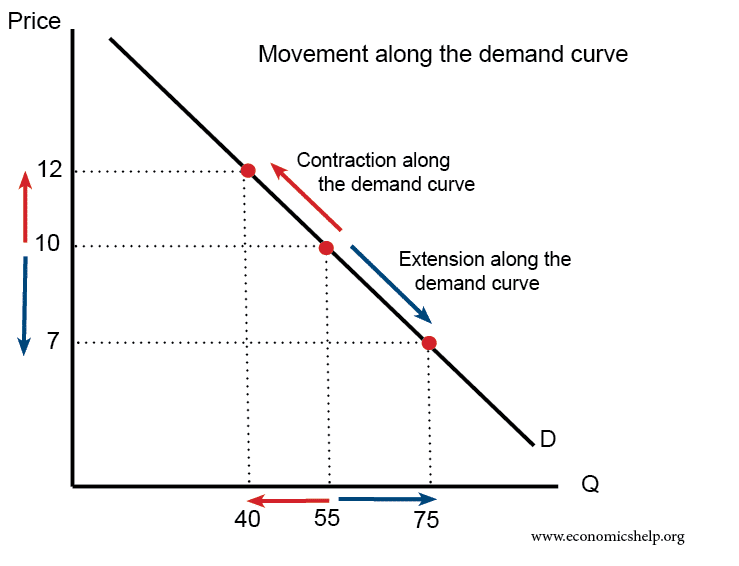
Demand curve
A contraction on the demand curve is due to higher price leading to lower demand
An extension on the demand curve is due to lower price leading to higher demand.
The supply curve
A higher price causes an extension along the supply curve (more is supplied)
A lower price causes a contraction along the supply curve (less is supplied)
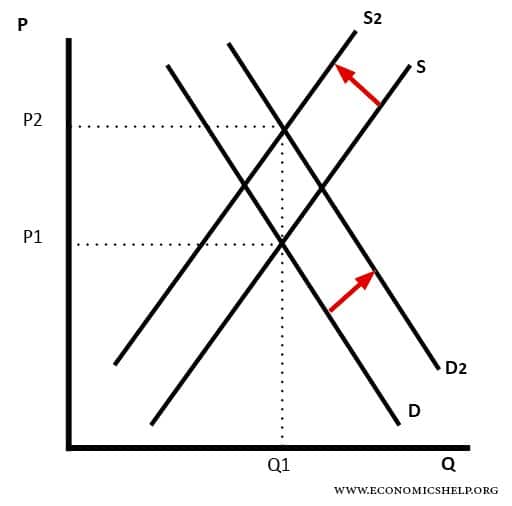
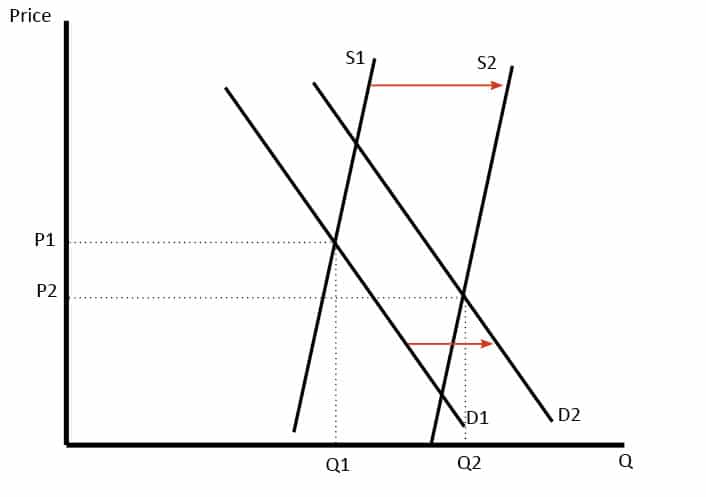
Supply Shifts to the left
In this diagram the supply curve shifts to the left. It leads to a higher price and fall in quantity demand. The supply curve may shift to the left because of:
Higher costs of production
Higher taxes
Fall in productivity
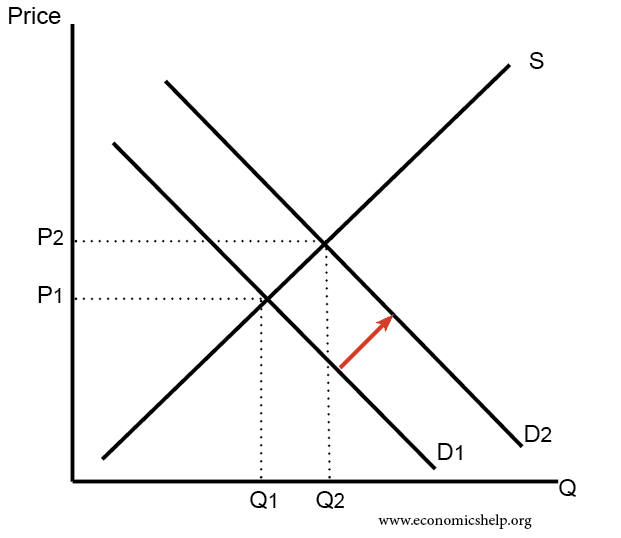
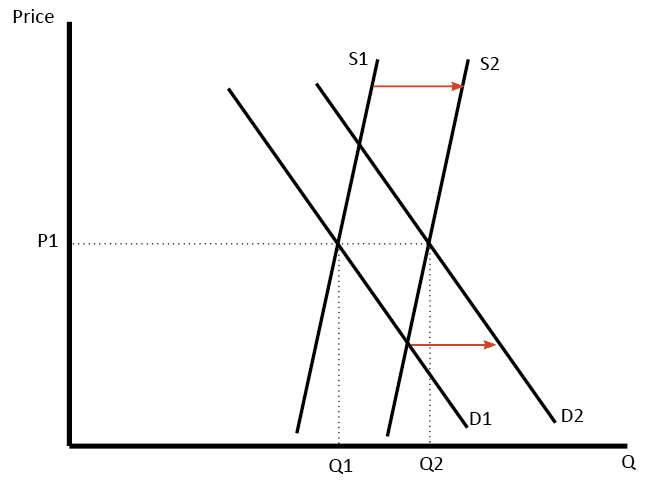
Supply and Demand Shift Right
In this diagram, supply and demand have shifted to the right. This has led an increase in quantity (Q1 to Q2) but price has stayed the same.
It is possible, that if there is an increase in demand (D1 to D2) this encourages firms to produce more and so supply increases as well.
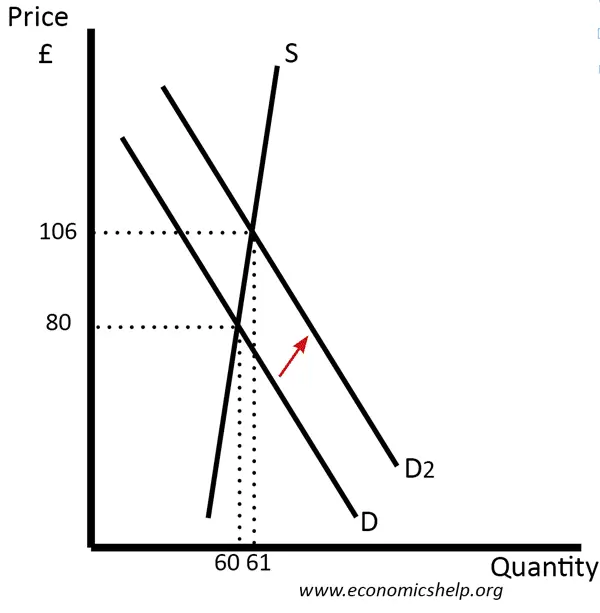
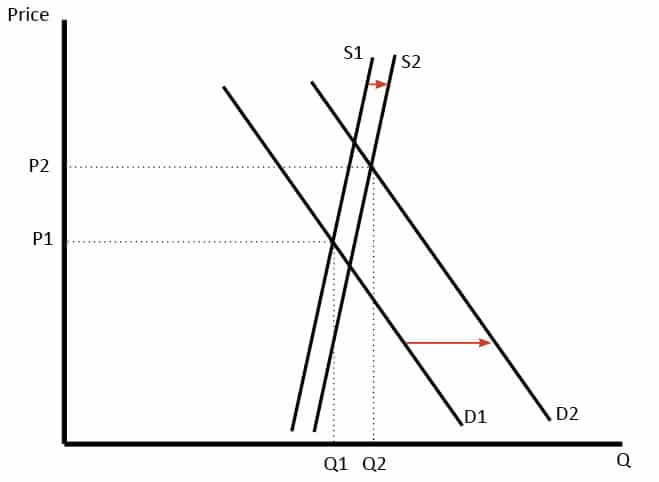
Diagram showing Increase in Price
In this diagram, we have rising demand (D1 to D2) but also a fall in supply. The effect is to cause a large rise in price.
For example, if we run out of oil, supply will fall. However, economic growth means demand continues to rise.
Increase in Demand
An increase in demand leads to higher price and higher quantity.
Increase in demand with inelastic supply
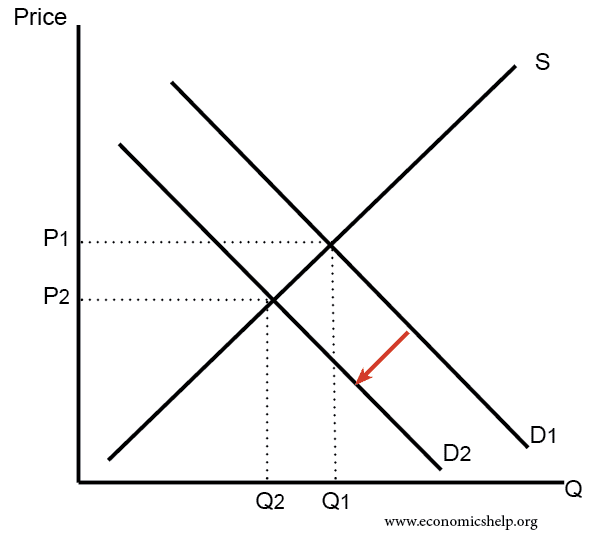
A Fall in Demand
Fall in demand increase supply
Fall in Supply
Fall in supply causing lower quantity and higher price.
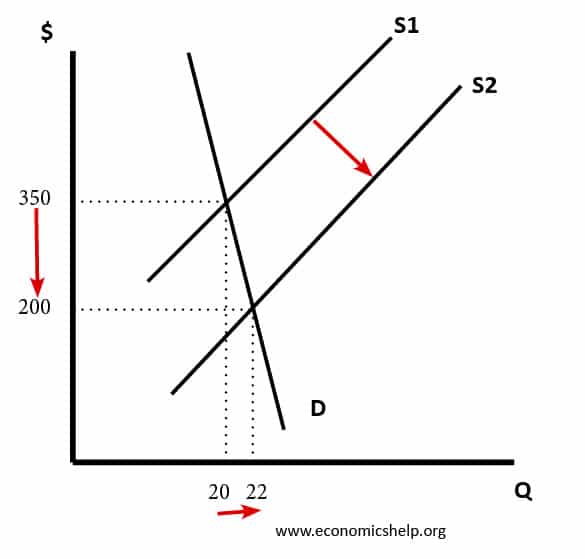
Increase in supply – inelastic demandAn increase in supply when demand is inelastic only causes a small rise in demand.
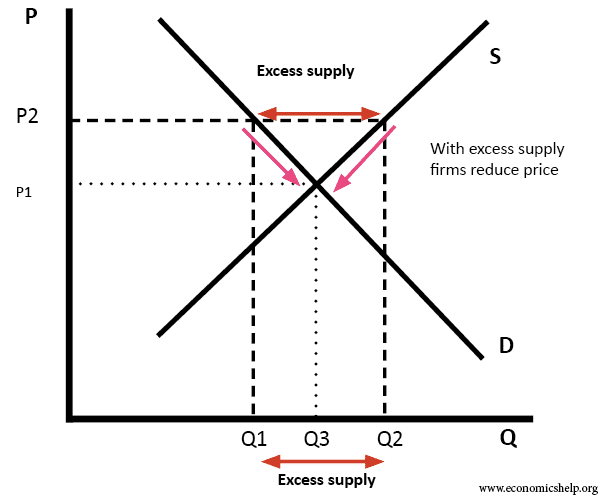
Market equilibrium
Excess supply involves price above the equilibrium
Excess demand
Increase in demand
Rise in demand and rise in supplt
Increase in demand causes supply to increase in long term.
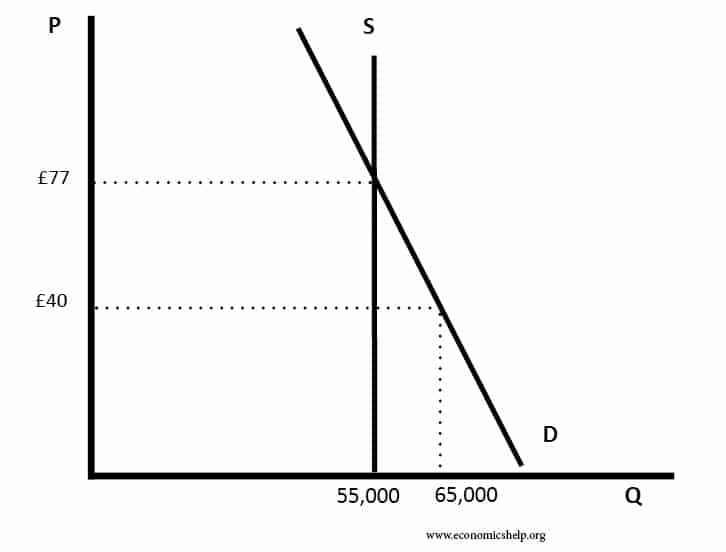
Price set below the equilibrium (football)
Inelastic supply and bigger increase in demand
UK Housing market has often seen demand increase at a faster rate than supply, causing price to rise.
Supply increase same as demand.
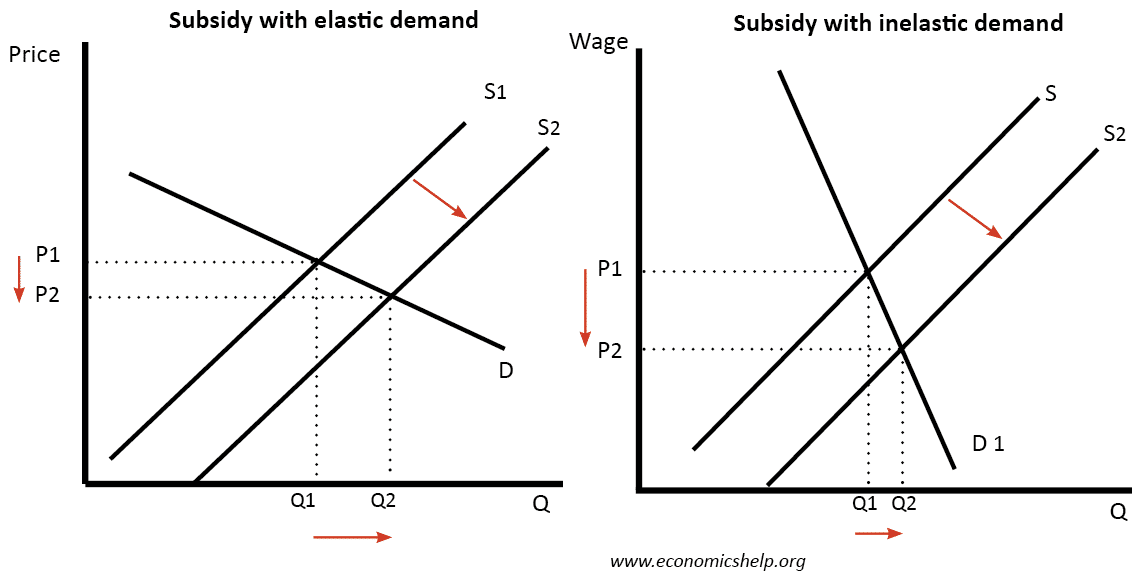
Elasticity
The effect of a subsidy depends on the elasticity of demand
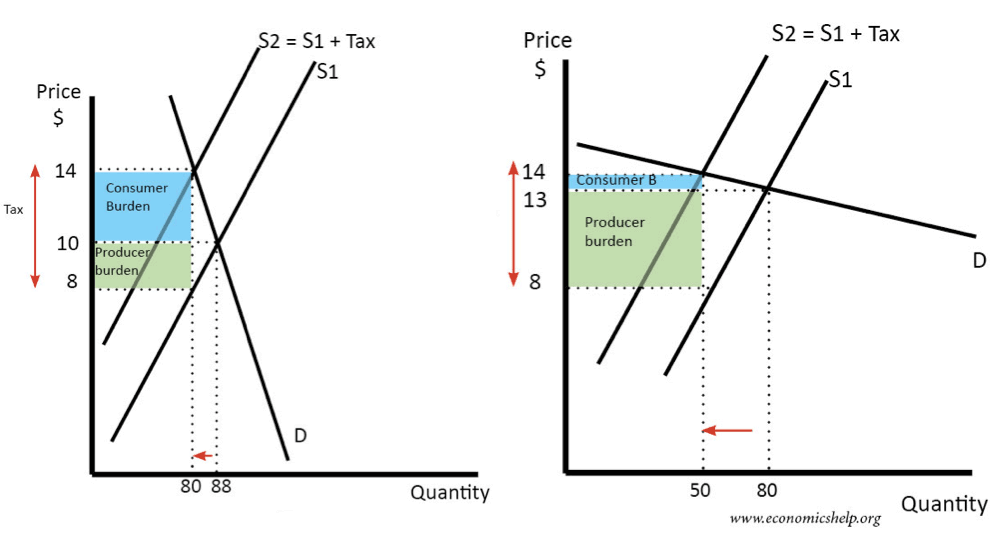
The effect of a tax depends on elasticity of demand
The effect of rise in demand depends on elasticity of supply
i am a student doing economics AS and i have found your webside very interesting i would like you to find out what diagrams can be used to show market change


i am a student doing economics AS and i have found your webside very interesting i would like you to find out what diagrams can be used to show market change
very helpful stuff for an as economics student 🙂
It Is Very Useful For Every Economics Student
People Want More Point On Inflation And Stagflation
It’s very helpfull
thanks a lot, had a thought that economics is another tough unit, have lean alot
Wow this great and very helpful
This is really helpful for economics students
which diagram can I use to explain demand and supply?
Great help for my students.
Useful site to the All Economist
Very simple explanation and well presented with understandable graphs.
thank you, appreciated
very helpful, thanks a lot