After a sharp increase in the 1980s, income inequality appears to have slightly improved in recent years.

However, this general measure of inequality fails to capture many of the increasing divides across the country. Whilst the income share of the top 1% has grown, the poorest 10% have faced falling living standards in a cost-of-living crisis that has been unequally felt. We will also explain why the UK is increasingly divided by geography, take out London and the south-east and the UK is one of the poorest regions in Europe, worse off than the poorest US state Mississippi. What’s going on with inequality and what can be done about it?
The biggest growth in inequality in recent years is between median incomes and the poorest 10% of the population. One factor has been the freezing of benefits and high inflation which affected low income groups the most.

This has caused around 5 million people to be living close to a negative budget, As a result around 15% of households report food insecurity. In the past couple of years, there has been a 26% increase in the cost of a healthy diet. Many households are failing to eat well and this can be seen with poor nutrition leading to a worrying rise in hospital admissions for nutrient deficiency.

From this income inequality, we are experiencing inequality of health outcomes. Life expectancy at birth for men living in the most deprived areas is 74.1 years, compared with 83.5 years for men in the least deprived (a difference of 9.4 years) The gap for women is slightly less at 7.7 years. An even bigger disparity occurs with Healthy life expectancy – a key metric for quality of life. For example, every town in region in the northeast is below the national average.

To give a big contrast, healthy life expectancy in Richmond Upon Thames it is 71. But Blackpool it is 51. Unsurprisingly Blackpool has significantly lower income levels. (Richmond and Hounslow – £51,623) Blackpool £22,108. The problem is that we are seeing a negative cycle of poverty causing poor health, which in turn restricts economic opportunities to work causing poverty. In the short term, benefit freezes are exacerbating inequality. But, a long-term sustainable solution is to tackle the worrying rise in economic inactivity and the increasing disparities in health outcomes.
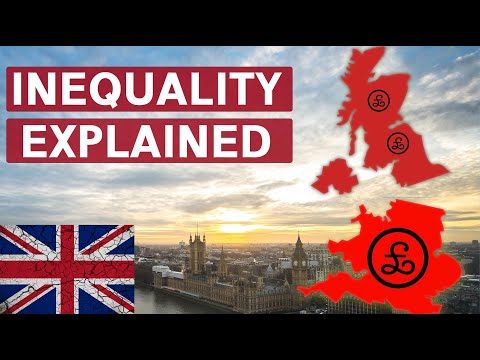
Regional Inequality

Whilst income inequality gains relatively little media attention, there has been more focus on regional inequality, especially since the Brexit vote of 2016, which raised the prominence of the left behind towns and regions. Firstly, geographical inequality is quite striking. London GDP per capita is more than double the vast majority of regions. London attracts the most population and gains the most investment per head. It is more than symbolic that major infrastructure projects to the north got cancelled, with London attracting the most transport investment. A major issue is that in the past few decades, the UK has become a service sector-oriented economy and manufacturing has declined. London has captured most of this growth in service sector exports, the result is that the highest income growth has been in the regions which were rich to begin with. Success is breeding success in London, but the left behind regions are left struggling. If we took out London, the UK would be significantly poorer.
Though it is worth noting that London is one of few regions with a net positive fiscal balance. In other words, high incomes in London, are subsidising poorer regions. The dominance of London is much greater than comparable countries and capital cities. If we took away the biggest city, it is the UK which would have biggest decline. This is not just about inequality – the reliance on London and the golden triangle to Cambridge and Oxford is limiting the UK’s scope for economic growth outside the congested capital.

Whilst London and the south east has benefited from the growth of the service sector and finance, the midlands and northern regions have seen some of the fastest rates of deindustrialisation in Europe. This pace of decline has proved difficult to successfully regenerate, leading to relatively low paid jobs and job insecurity. One factor in income levels is a relative lack of graduate jobs outside London and this could explain relatively lower rates of graduate degrees in other regions.

Of course, London itself is very diverse. If we look at the richest and poorest regions of the UK. The richest areas are mostly in London. There is a huge contrast between these different boroughs. But, there is also large inequality within London itself. Tower Hamlets claims a GDP per capita of £128,000 due to Canary Wharf being in the borough, but it also one of the most deprived boroughs in the country, 30% are in receipt of housing benefit and 44 per cent of households are in income poverty.
You would expect if London economy was much stronger with higher wages, that would attract labour to reduce income inequality. But, housing costs remain a major barrier. In fact, people are being forced to leave London, because they cannot afford housing. For the poorest quarter of the population. If we take into account rental costs, then London has one of the lowest disposable incomes in England. For the top 25%, London still has the highest net incomes. But, this is why income levels can be misleading. A big question for living standards is are you paying market rent or a homeowner who has paid off their mortgage?
Housing

In fact, housing is increasingly a great divide and source of inequality in the UK. House prices are nearly eight times income, meaning the average worker is unable to buy a house, but is forced to pay market rents. In recent years, the share of income going on rent has increased Those who have paid off their mortgage are in a very different financial situation. The rise in house prices has contributed to a growth of wealth inequality in the UK. This particularly matters for those who are unable to buy, but when reaching retirement age, still have to pay market rents. Whilst the housing market used to be meritocratic, it has increasingly depended on whether parents can help their children buy.
Measuring homeownership rates by population means there has been a significant decline in homeownership rates. The housing market explains, why inequality of outcomes and opportunities is more acute than income inequality statistics suggest. A key factor is lack of building in precisely those areas where housing demand is most acute.
Policies to Improve Inequality
What can be done about this? Michael Heseltine, a life-long supporter of regional devolution, told the researchers: “British economic policy has been run for the south-east of England.” And the problem is the service sector based nature of the economy has only served to reinforce the trends towards large metropolitan areas in particular.
The government’s levelling up scheme is a policy designed to improve transport, investment and educational opportunities in more deprived areas. The policy is fine in principle, but has been criticised for lack of funding. In particular, the levelling up funds are dwarfed by a decline in local council funding.
One of the successes of UK policy in recent years has been the national living wage. The increase in minimum wage has improved the incomes of many workers – this is especially important since the decline of trade unions. It has also increased the gap between wage and benefits. However, the minimum wage can only do so much. Although unemployment is low, further increases could pressure on employment in low paid areas.
One welcome development of recent years is that unemployment rates have fallen, and this contributes to reduced inequality. But, there are two issues. Firstly a growth in part-time and temporary contracts. Exemplified by a growth in zero-hour contracts with an increased job insecurity.
The other politically tricky issue is benefits. In the past decade, benefits have been frozen or increased at a slower rate than wages. But, limits on housing benefits and child benefits do make a big difference in increasing effective poverty rates. The difficulty is both the state of public finances combined with a lack of political will. Pensions have certainly increased at a faster rate than in-work benefits. But, higher benefits are only a partial solution, a long-term sustainable solution is increasing participation rates, reducing ill-health and attracting good-paying jobs.
Another problem is that it is not so much inequality but, very low economic growth, which means there is a smaller economic pie to distribute. Inequality levels in the UK are worse than some countries, but better than in others. But, the past decade of very low growth had magnified any increase in inequality. This video looks at the wider demise of the UK economy and why wage growth has been so low.
Related
External sources