A historical look at US National debt from 1790 to 2021
The national debt is basically the amount the government owe to the private sector and other holders of US Treasuries. National debt is the accumulation of government borrowing over many years. The budget deficit is the annual amount the US government need to borrow in a year. It is successive budget deficits that cause a rise in national debt.
A more precise definition. US Federal National debt is the total amount of Treasury securities held by bodies outside the federal government (mostly private sector investors, Federal Reserve and foreign private sector investors).
In 2021
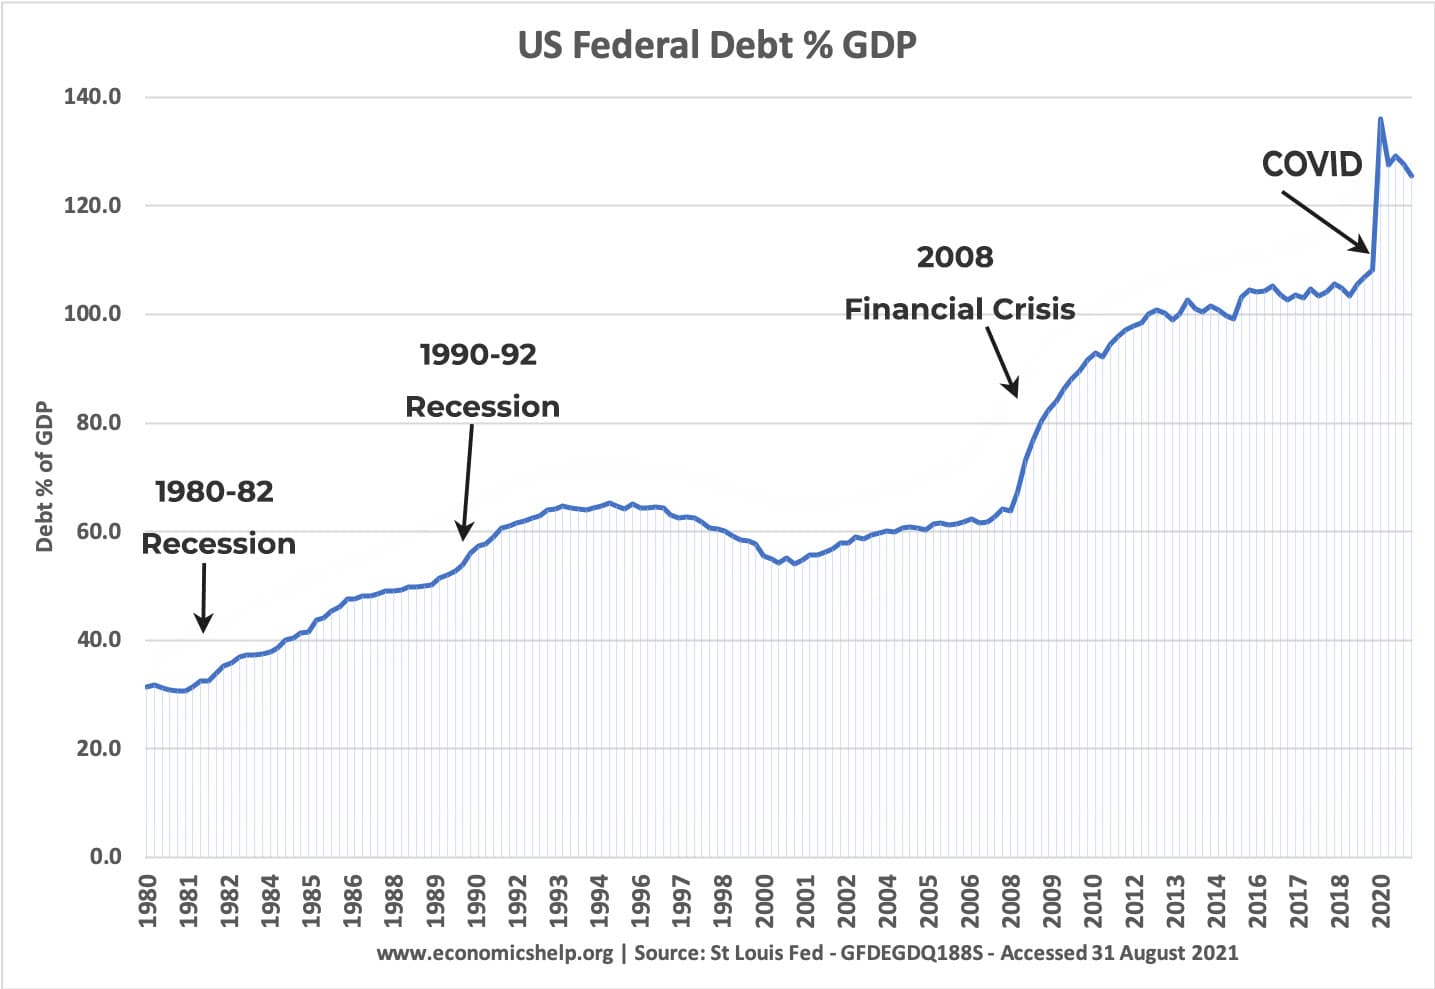
- Total US Federal Debt is $28 trillion 125% of GDP (St Louis Fed).
- US Federal debt held by the public is $22 trillion (St Louis Fed) (98% of GDP) (St Louis Fed)
US debt through history
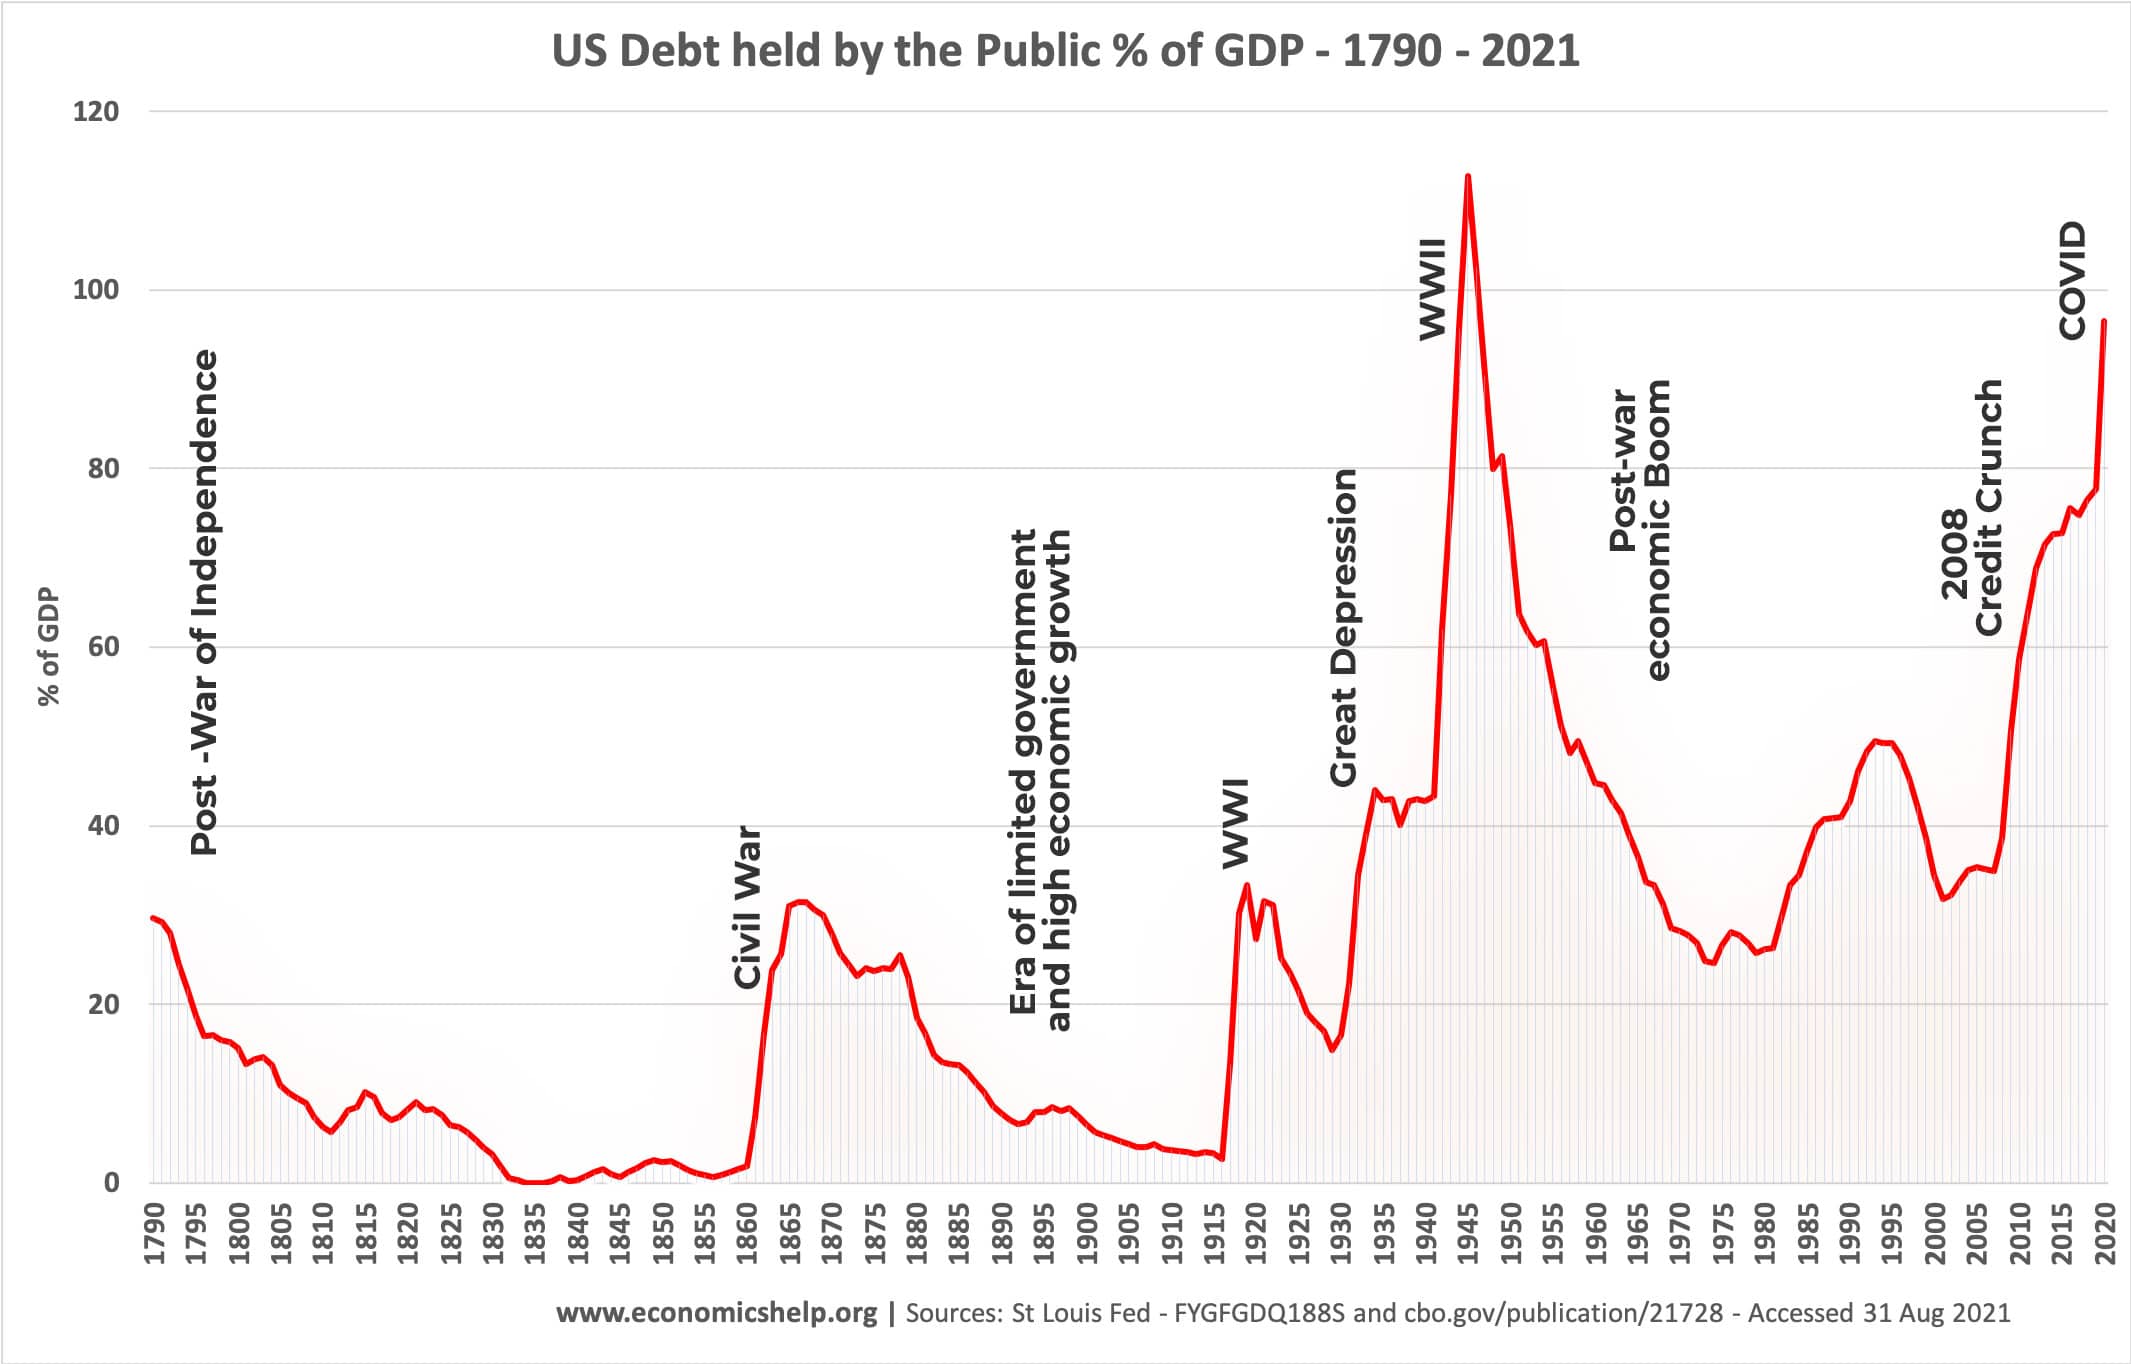
This graph shows national debt as a % of GDP (the size of the economy). Through these figures on national debt, we can see major events in American history.
- After the war of independence, the Founding Fathers were very concerned about government debt and over the next 40 years, great efforts were made to pay it back. This was achieved through levying Federal taxes (primarily import duties) and also economic growth from the developing US economy helped to reduce the burden. It was also a period of minimal Federal expenditure.
- Civil War Period – After the start of the Civil War in 1961, Federal debt rose sharply to finance the cost of war. Congress also approved a temporary income tax of 3% (which expired in 1872)
- After the Civil War debt declined as the Federal Government returned to minimal government expenditure. Until the First World War, the government retained limited expenditure, although around the turn of the century, the progressive movement did encourage greater Federal intervention in some aspects of the economy.
- National debt increased during WWI and then during the Great Depression, but by current standards was still quite a limited increase. This reflected a different philosophy of seeking to balance the budget and a very minimal welfare state. Apart from limited government intervention as part of Roosevelt’s New Deal – post 1932, there was only a limited expansion of government borrowing to offset the fall in economic growth.
- World War II saw US debt reach its peak at over 113% of GDP as the government undertook massive military spending.
- In the post-war period, national debt steadily fell – despite growth in Federal spending on roads, a welfare state and military campaigns in Korea and Vietnam. The fall in debt to GDP was largely due to the rapid economic growth, which caused GDP to rise significantly faster than the level of debt.
1980s
By 1980, US debt was at a near time low of 26% of GDP. This rose first, due to the steep recession of 1981 and then due to significant tax cuts combined with significant increases in Federal spending (in particular military spending)
1990s
After the 1992 recession ended, the US economy returned to a period of strong economic growth – enabling a rare budget surplus and fall in debt levels during the 1990s. It was also a period of relative fiscal restraint.
2000s
Debt gradually increased in the early 2000s, with extra government spending partly on the war on terror, growing social security budgets and some tax cuts.
2008 Credit crunch
The 2008 Credit crunch and resulting financial crisis caused a rapid growth in debt as tax revenues from finance dried up. Debt began to be stabilised until 2016, when the 2016 Trump tax cuts led to small rise in debt.
Covid 2020
Covid caused another shock to debt levels as aspects of the economy were put in lockdown. Tax receipts fell and the government spent on emergency payments to business and consumers.
Total US Debt (nominal figures)
- 1910 – $2.6 bn
- 1940 – $50.0 bn
- 1990 – $3,233 bn ($3.2 Trillion)
- 2021 – $28,529bn ($29 Trillion)
- Fiscal Data Treasury.gov
Real US Debt
To make comparisons between years, we need to adjust for inflation.
- Real debt = nominal debt – inflation
Gross debt vs Public Debt
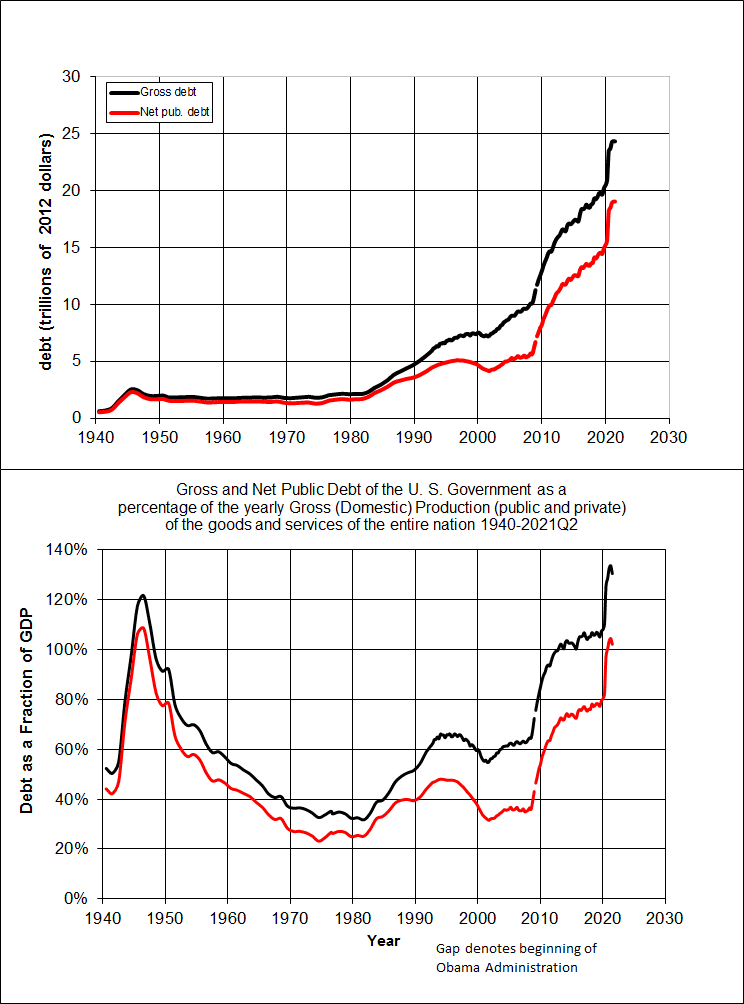
A potential confusion is that there are two main measures of national debt
- Public debt – Debt held by investors and bodies outside Federal Government.
- Gross debt =- Public debt + securities held by departments within the Federal Government, e.g. Social Security Fund
The difference between these figures has grown in recent years.
from: wikipedia US Debt
The Public debt is the US debt held by private sector.
Gross debt includes debt that the government holds itself.
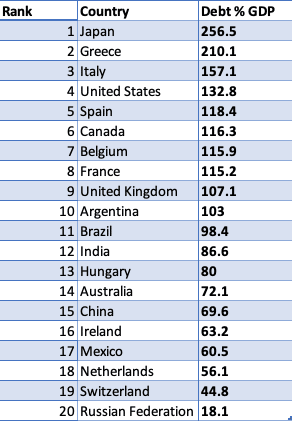
US debt compared

Related


3 thoughts on “History of US National Debt”
Comments are closed.