Readers Question: It is unclear what Seasonally adjusted means?
Seasonally adjusted figures take into account seasonal factors in time series.
Unemployment will have seasonal patterns. For example, over the summer holidays extra jobs are likely to be created and unemployment will typically fall. In winter, unemployment may rise as less tourist jobs are available. (apart from a few weeks over Christmas).
Therefore, seasonally adjusted figures take away these usual seasonal changes in unemployment to give a better guide to the underlying statistic.
At the height of the summer, the actual unemployment figure will be quite low. But, the seasonally adjusted figure will be higher because it takes into account this seasonal fall in unemployment.
Example
For example, unemployment figures for the month of June may show a fall of 10,000 to 7%. However, statisticians may know that on average unemployment falls 100,000 in the month of June because it is the start of the summer holidays (more jobs created). Therefore, the seasonally adjusted figure for June will show a higher unemployment rate than the actual figure.
This is useful because if unemployment fell 10,000 you may think there is a downward trend in unemployment. But, looking at the seasonally adjusted figure the unemployment is much worse than you would expect for this time of the year.
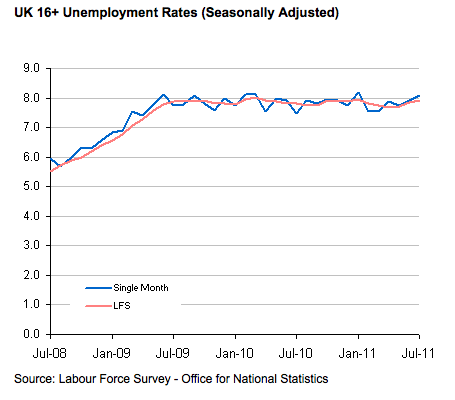
Seasonally Adjusted Unemployment
 source: ONS
Seasonally Adjusted Inflation
Inflation can also have seasonally predictable factors. For example, before Christmas prices may tend to rise as retailers seek to maximised profits. But, in January there will be a seasonal cut in prices (January sales). The effect of January sales could show a dip in prices. But, seasonally adjusted figures will look at whole past 12 months and not just effect of one month.
12 Month Figures.
One way to avoid seasonal factors is look at the change in statistics over the past 12 months. This takes all seasonal changes into account because you are comparing one set of 12 months with the last. However, sometimes, you need to analyse changes in the past month to give more updated picture of what is occurring. In this case seasonally adjusted monthly figures can be helpful.

1 thought on “Seasonally Adjusted Figures”
Comments are closed.