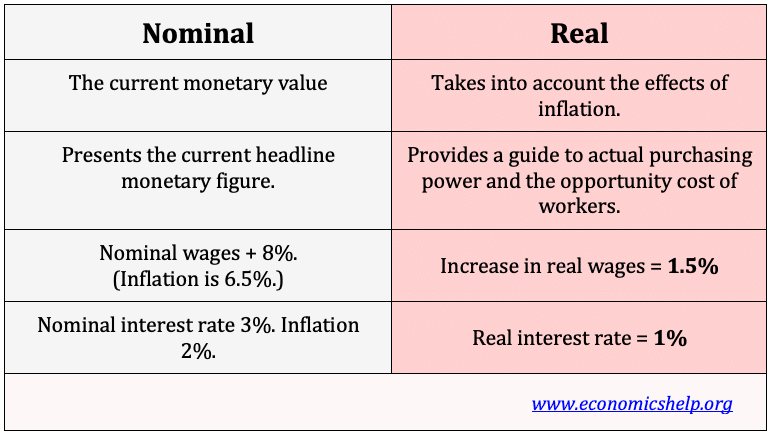
- Nominal values are the current monetary values.
- Real values are adjusted for inflation and show prices/wages at constant prices.
- Real values give a better guide to what you can actually buy and the opportunity costs you face.
Example of real vs nominal
- If you receive an 8% increase in your wages from £100 to £108, this is the nominal increase.
- However, if inflation is 2%, then the real increase in wages is (8-2%) 6%.
- The real wage is a better guide to how your living standards changes. It shows what you are actually able to buy with the extra increase in wages.
- If wages increased 80%, but inflation was also 80%, the real increase in wages would be 0% – in effect, despite the monetary increase in wages of 80%, the amount of goods and services you could buy would be the same.
Real wages
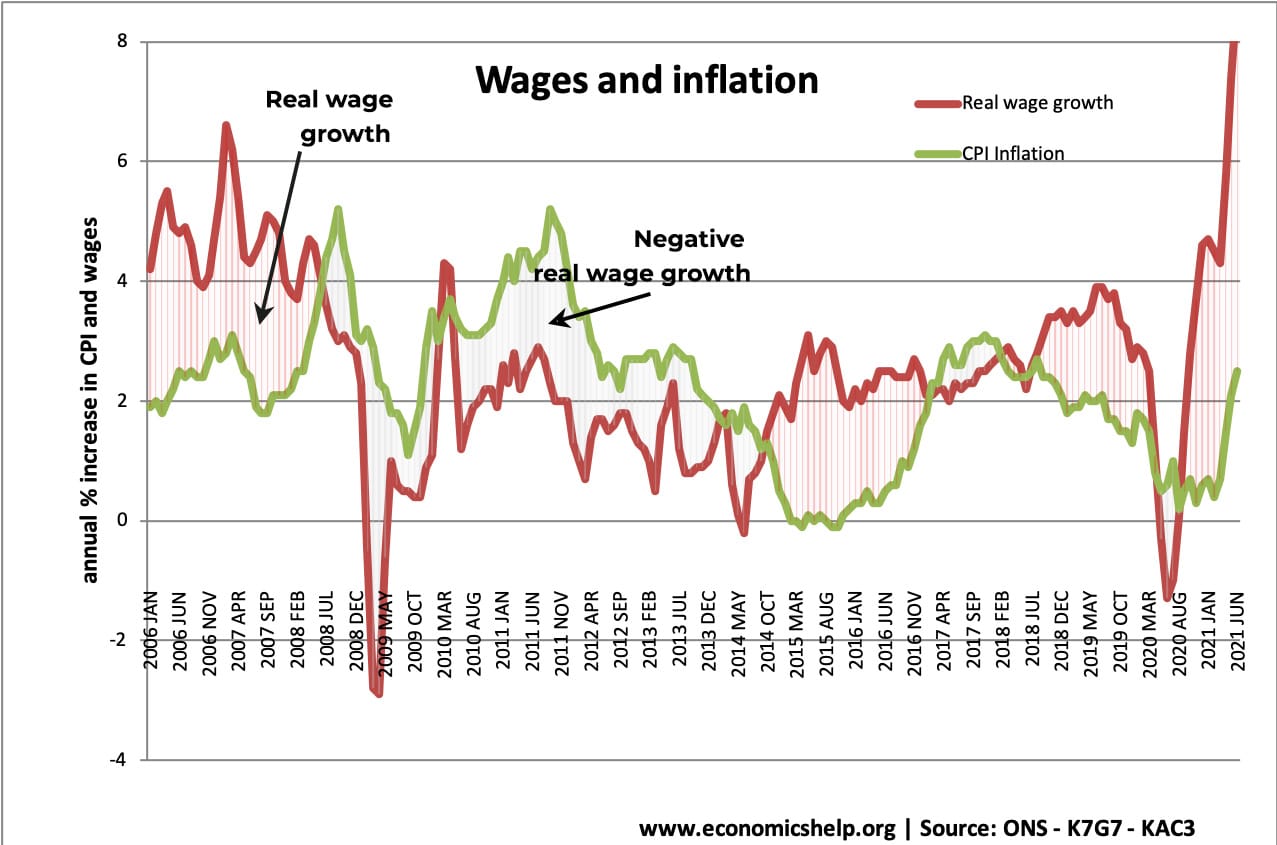
- This graph shows nominal wage growth and inflation. Between 2006 and 2008, nominal wage growth was higher than inflation – causing positive real wage growth of roughly 2% a year.
- However, between 2009 and 2014 we have the unusual circumstance of inflation higher than nominal wage growth – leading to negative real wages.
Converting nominal prices to real prices
How much is £1,000 from 1940 worth in today’s money?
- 1940: Consumer price index CPI = 32
- 1990: Consumer price index CPI = 184
- Past value in real terms of current Pounds = CPI in start year ÷ CPI index at end year
- Therefore $1,000 × 184÷32 = £5,750
How much is a £200,000 house worth in 1940’s money?
- 1940 Consumer price index CPI = 32
- 1990 CPI = 184
- Real value of good in previous years money = CPI in start year x CPI at end year
- £200,000 x 32 ÷ 184 = £34,782
Commodity prices nominal and real

The adjusted price is the inflation adjusted price. The nominal price of gold shows a bigger increase, but using constant prices and adjusting for inflationary increases in the value of money we see the real price of gold increase from $200 in 1968 to $800 in 2008.
The nominal price of gold was $39.
Other examples – real and nominal house prices

Between 1987 and 2007, nominal house prices rose from £40,000 to £180,000 = 350%
However, this is misleading to the inflation-adjusted price. The real price rose from £90,000 to £181,000 – closer to 100% real increase.
Nominal and real GDP

This shows how real GDP and nominal GDP are different with inflation in the economy.
- Between 2000 and 2001, nominal GDP rose 7%, but with inflation of 2%, the real increase was a 5% rise.
Real and nominal interest rates
- The real interest rate is the nominal interest rate – inflation rate.
- For example, if the Bank of England set base rates of 0.75% and the CPI inflation rate is 1.80%. Then the real interest rate is said to be -1.05%

The real interest rate is of great importance to savers and borrowers.
Between 2003 and 2008, interest rates are significantly higher than inflation. This means savers are getting a good return on their savings. There is a positive real interest rate. After 2009, inflation is higher than interest rates – there is a negative real interest rate. Savers will be getting a smaller interest payment than the amount money is declining in value.
If interest rates are 15% – then savers will get a high return, but if inflation is 20%, their savings will still be declining in value.
Historical real interest rates
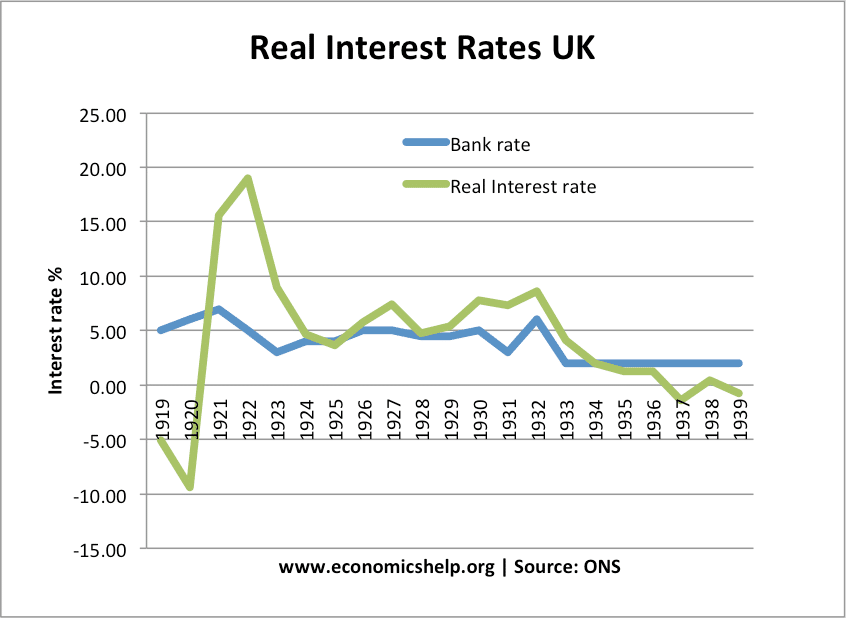
In the 1920s, the UK had deflation – falling prices. Therefore, the real interest rate increased to nearly 20%,
More on real interest rates
Government spending
A government could say spending on the NHS has increased from £100bn to £135bn in five years – representing a 35% increase in spending. However, do they mean nominal or real increase?
The real increase may sound less impressive. One way to adjust for inflation is to measure at constant prices. If we measure at constant prices (taking into account inflation) the real increase in spending is only £100bn to £118bn – an increase of only 18%
Pension spending
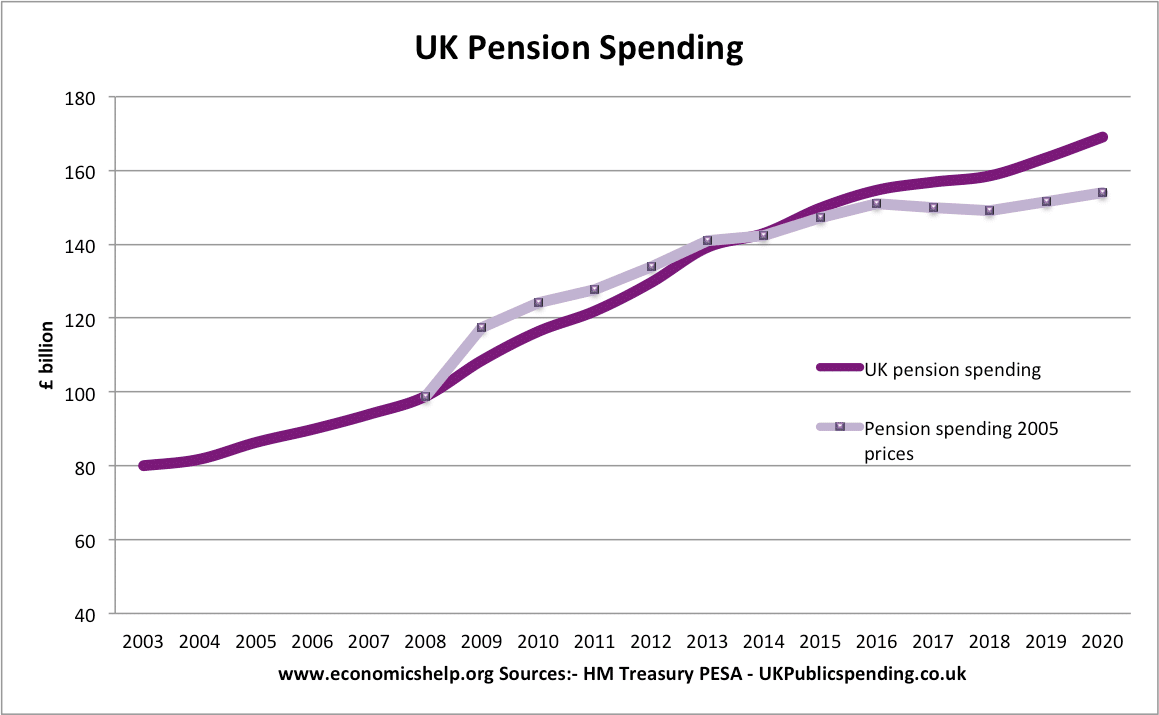
This is during a period of low inflation from 2005 to 2020, UK pension spending is forecast to rise to £170bn. But, the real increase is only to £155bn.
Related
Difference between net nd gross values
I really wanted to learn more about this things, but the only way u can guide me the right path and to massage me the questions banks were to research more and to get lot of experience you actually know that student most research, but if you help me to know the website I wii learn more. thanks you