A list of energy use (kg of oil equivalent) per capita by country.
The list shows a huge disparity between the highest energy users and the lowest.
It is worth bearing in mind:
- Colder countries understandably have a relatively higher use of energy because more resources are devoted towards heating.
- Energy producers have a high energy use, partly because energy tends to be much cheaper. (See cost of petrol per country)
- The country with the highest energy use per capita is Iceland. A significant part of Iceland’s energy use is thermal energy from naturally occurring volcanic springs. Thus this energy is cheap and does not involve burning fossil fuels.
- Nevertheless, the huge disparity in energy use primarily reflects different income levels throughout the world.
Energy Use of Major Countries

CO2 emissions per capita
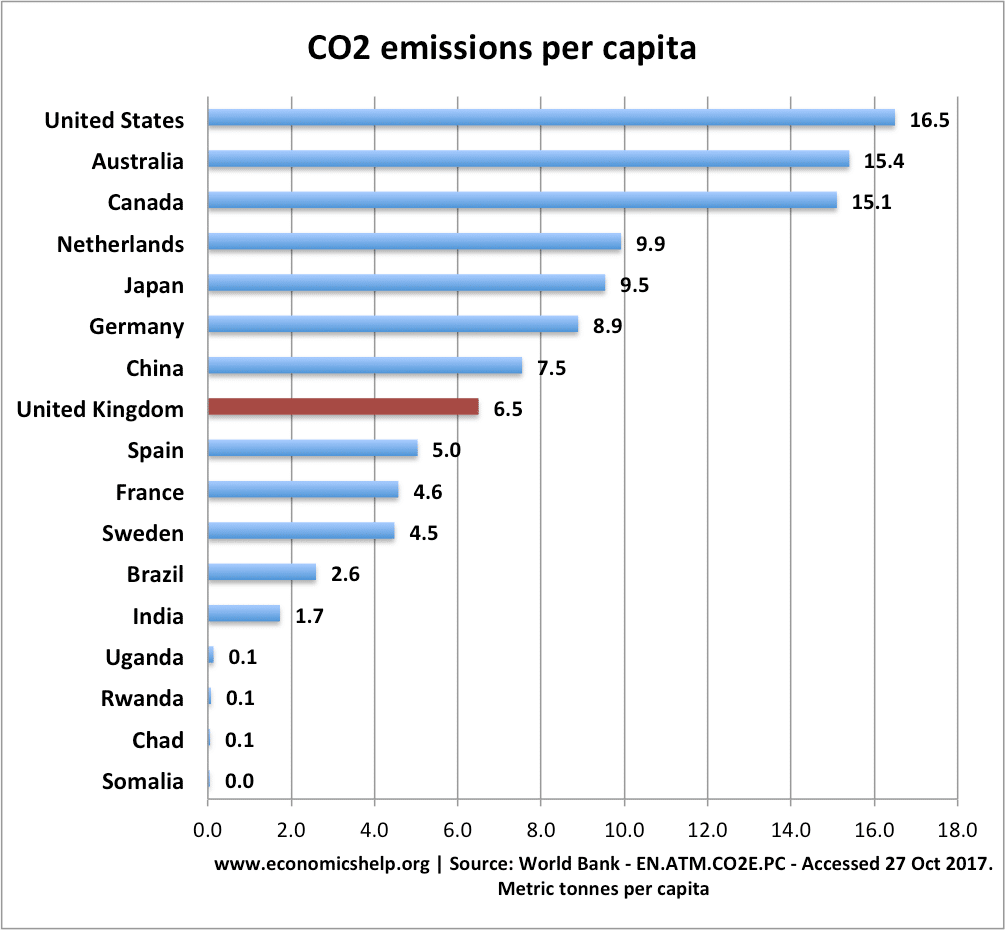
A close correlation between energy use and CO2 emissions per capita.
With the exception of Iceland (which generates its power from renewable, natural resources)
Highest Energy Users per Capita
| 1 | Iceland | 16404.7 |
| 2 | Trinidad and Tobago | 15158.2 |
| 3 | Qatar | 14911.1 |
| 4 | Kuwait | 11402.1 |
| 5 | United Arab Emirates | 8588.0 |
| 6 | Bahrain | 8096.3 |
| 7 | Brunei Darussalam | 7971.3 |
| 8 | Luxembourg | 7934.1 |
| 9 | Canada | 7534.0 |
| 10 | North America | 7098.5 |
| 11 | United States | 7050.6 |
| 12 | Finland | 6212.9 |
| 13 | Australia | 5970.9 |
| 14 | Saudi Arabia | 5888.1 |
| 15 | Norway | 5849.3 |
| 16 | Oman | 5554.1 |
| 17 | Belgium | 5299.7 |
| 18 | Sweden | 4883.4 |
| 19 | High income | 4853.1 |
| 20 | Netherlands | 4729.2 |
| 21 | Korea, Rep. | 4659.8 |
| 22 | Russian Federation | 4558.6 |
| 23 | OECD members | 4260.3 |
| 24 | Kazakhstan | 4090.8 |
| 25 | New Zealand | 4032.3 |
| 26 | Czech Republic | 4004.0 |
| 27 | France | 3958.8 |
| 28 | Turkmenistan | 3932.8 |
| 29 | Germany | 3889.1 |
| 30 | Austria | 3784.4 |
| 31 | Singapore | 3704.4 |
| 32 | Japan | 3700.2 |
| 33 | Estonia | 3542.9 |
| 34 | Euro area | 3534.5 |
| 35 | Switzerland | 3480.5 |
| 36 | Slovenia | 3416.6 |
| 37 | Denmark | 3368.7 |
| 38 | European Union | 3305.7 |
| 39 | Libya | 3258.2 |
| 40 | Ireland | 3215.9 |
| 41 | United Kingdom | 3183.3 |
| 42 | Europe & Central Asia (all income levels) | 3160.8 |
| 43 | Slovak Republic | 3086.1 |
| 44 | Iran, Islamic Rep. | 2951.3 |
| 45 | South Africa | 2920.5 |
| 46 | Israel | 2878.3 |
| 47 | Europe & Central Asia (developing only) | 2830.5 |
| 48 | Belarus | 2814.8 |
| 49 | Spain | 2755.9 |
| 50 | Italy | 2735.0 |
| 51 | Greece | 2609.2 |
| 52 | Lithuania | 2511.7 |
| 53 | Ukraine | 2507.4 |
| 54 | Hungary | 2480.3 |
| 55 | Poland | 2463.5 |
| 56 | Malaysia | 2391.0 |
| 57 | Venezuela, RB | 2356.9 |
| 58 | Bulgaria | 2304.5 |
| 59 | Cyprus | 2297.7 |
| 60 | Portugal | 2266.3 |
| 61 | Hong Kong SAR, China | 2133.0 |
| 62 | Middle East & North Africa (all income levels) | 2070.1 |
| 63 | Serbia | 1973.8 |
| 64 | Croatia | 1964.9 |
| 65 | Malta | 1931.5 |
| 66 | Latvia | 1871.4 |
| 67 | Argentina | 1853.3 |
| 68 | Upper middle income | 1844.6 |
| 69 | World | 1790.1 |
| 70 | Uzbekistan | 1757.8 |
| 71 | East Asia & Pacific (all income levels) | 1733.6 |
| 72 | Chile | 1697.6 |
| 73 | China | 1695.3 |
| 74 | Arab World | 1678.1 |
| 75 | Romania | 1601.8 |
| 76 | Lebanon | 1580.3 |
| 77 | Bosnia and Herzegovina | 1579.9 |
| 78 | Mexico | 1558.8 |
| 79 | Thailand | 1503.7 |
| 80 | East Asia & Pacific (developing only) | 1436.5 |
| 81 | Middle East & North Africa (developing only) | 1398.9 |
| 82 | Turkey | 1359.3 |
| 83 | Macedonia, FYR | 1351.9 |
| 84 | Azerbaijan | 1337.6 |
| 85 | Latin America & Caribbean (all income levels) | 1277.8 |
| 86 | Jordan | 1259.6 |
| 87 | Middle income | 1256.1 |
| 88 | Latin America & Caribbean (developing only) | 1245.5 |
| 89 | Brazil | 1242.8 |
| 90 | Uruguay | 1223.7 |
| 91 | Gabon | 1214.2 |
| 92 | Jamaica | 1208.2 |
| 93 | Mongolia | 1193.9 |
| 94 | Low & middle income | 1163.1 |
| 95 | Algeria | 1137.6 |
| 96 | Syrian Arab Republic | 1123.0 |
| 97 | Costa Rica | 1067.1 |
| 98 | Iraq | 1034.9 |
| 99 | Botswana | 1033.7 |
| 100 | Cuba | 1021.6 |
| 101 | Egypt, Arab Rep. | 903.4 |
| 102 | Panama | 895.5 |
| 103 | Tunisia | 881.3 |
| 104 | Indonesia | 850.8 |
| 105 | Armenia | 843.2 |
| 106 | El Salvador | 828.2 |
| 107 | Dominican Republic | 826.1 |
| 108 | Ecuador | 796.0 |
| 109 | Korea, Dem. Rep. | 795.0 |
| 110 | Namibia | 763.8 |
| 111 | Zimbabwe | 762.7 |
| 112 | Paraguay | 749.4 |
| 113 | Vietnam | 744.5 |
| 114 | Georgia | 722.9 |
| 115 | Guatemala | 701.3 |
| 116 | Nigeria | 700.7 |
| 117 | Colombia | 697.2 |
| 118 | Sub-Saharan Africa (all income levels) | 693.6 |
| 119 | Sub-Saharan Africa (developing only) | 693.6 |
| 120 | Moldova | 686.9 |
| 121 | Lower middle income | 659.5 |
| 122 | Angola | 641.1 |
| 123 | Bolivia | 637.6 |
| 124 | Zambia | 617.5 |
| 125 | Honduras | 591.6 |
| 126 | India | 559.6 |
| 127 | Kyrgyz Republic | 559.2 |
| 128 | Peru | 550.3 |
| 129 | Nicaragua | 540.3 |
| 130 | Albania | 537.8 |
| 131 | Cote d’Ivoire | 535.0 |
| 132 | South Asia | 514.4 |
| 133 | Pakistan | 501.6 |
| 134 | Morocco | 476.8 |
| 135 | Kenya | 474.5 |
| 136 | Sri Lanka | 453.9 |
| 137 | Tanzania | 450.7 |
| 138 | Togo | 445.0 |
| 139 | Mozambique | 427.2 |
| 140 | Philippines | 423.6 |
| 141 | Benin | 404.0 |
| 142 | Ethiopia | 402.5 |
| 143 | Ghana | 387.9 |
| 144 | Sudan | 372.3 |
| 145 | Cambodia | 370.7 |
| 146 | Low income | 364.7 |
| 147 | Cameroon | 360.8 |
| 148 | Congo, Dem. Rep. | 357.0 |
| 149 | Congo, Rep. | 355.8 |
| 150 | Tajikistan | 341.8 |
| 151 | Least developed countries: UN classification | 339.8 |
| 152 | Nepal | 338.4 |
| 153 | Yemen, Rep. | 324.1 |
| 154 | Myanmar | 316.4 |
| 155 | Haiti | 263.1 |
| 156 | Senegal | 242.8 |
| 157 | Bangladesh | 201.3 |
| 158 | Eritrea | 142.3 |
Technical note on definition of energy use
Energy use refers to use of primary energy before transformation to other end-use fuels, which is equal to indigenous production plus imports and stock changes, minus exports and fuels supplied to ships and aircraft engaged in international transport.
These figures come from World Bank data series 2009. This is data up to 2011, but this is much more patchy.
Hi. Would be great if you can write up something about the role of regulator
let’s think big and understand the ENERGY for development in relation to climate change.
Africa needs Energy for development. SDG number 7