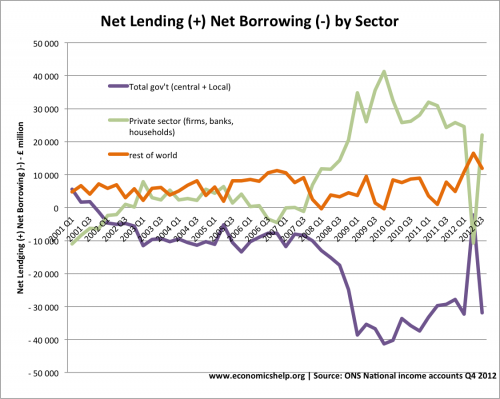
A graph showing net lending (+) and net borrowing (-) by sector in the UK economy.

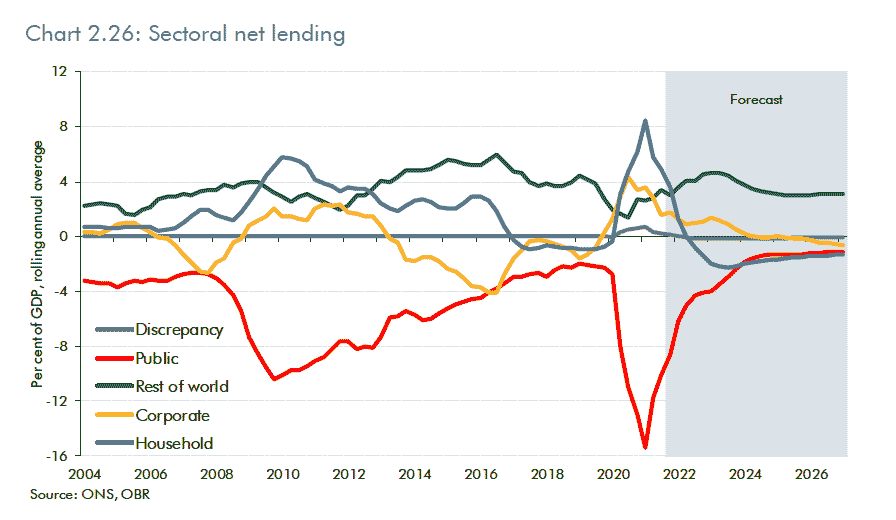
This shows how public borrowing is mirrored by a rise in private sector (household+corporate) saving. The two extremes are the financial crisis of 2009 and Covid lockdowns of 2021. In both cases, these events led to a rise in private sector saving. At the same time, government borrowing increases significantly.
It shows how government borrowing is, to a large extent, financed by higher private sector saving.

- I grouped Central gov’t and local gov’t into total government
- Private sector = Financial corporation, non-financial corporations and households.
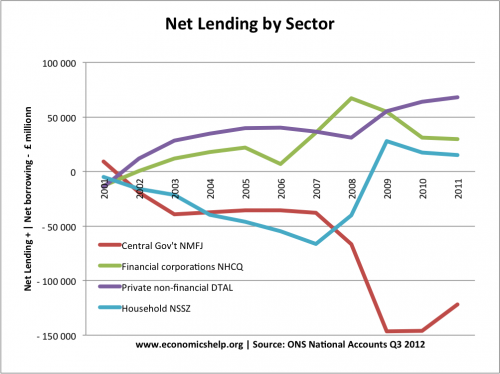
As you would expect, there is roughly an inverse relationship between government borrowing and private sector borrowing. As the private sector borrows less and becomes a net lender, the government becomes a net borrower.
You could also think of it as happening the other way, as the government borrow more, the private sector spend less and become net lenders.
But, in the recession, I think what is happening is that we are seeing a rise in the household savings ratio, and firms are increasing their cash reserves. Banks have also gone from net borrowers to net lenders. In this climate of depressed private sector spending and investment, it is to be hoped the government will step in and spend by borrowing from a private sector that want to save and pay off debts.

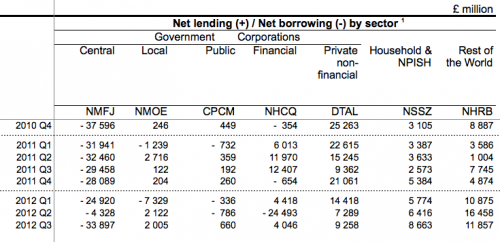
In 2012 Q2, there must have been a temporary surge in borrowing by financial corporations.
Net lending from the rest of the world helps fund the UK current account deficit. The increase in net lending towards the end of 2012 from the rest of the world, corresponds with a worsening of the current account in this period.

Further reading
- Keynesian economics – the principle of government borrowing
- When does Keynesianism work?
- UK national debt

1 thought on “Net lending and borrowing in UK by sector”
Comments are closed.